We took the final home-and-away ladder of every AFL season from 1994, the first year of the final eight, to 2026, the first of the final ten, from Wikipedia's season pages such as the 1994 AFL season. Each ladder was checked game count by game count, premiership points against wins and draws, and order against points and percentage, and the 2025 and 2026 ladders were cross-checked against an independent source. Wins here count a draw as half, which is how the ladder counts them: four points for a win, two for a draw.
How many wins an AFL team needs to make the top eight
The line moved little in 22-game seasons. The eighth-placed team had a median 12 wins, the ninth-placed team, the first one out, 11, and only once did eighth need more than 13 wins: North Melbourne finished 14-8 in 2012 and still had to settle for eighth on percentage behind Fremantle.
The odds by win total show where the line sits. Eleven wins was usually not enough, 5 of 28 teams, 18 percent. Twelve wins usually was, 69 percent. From 12.5 wins up, all 182 teams made it.
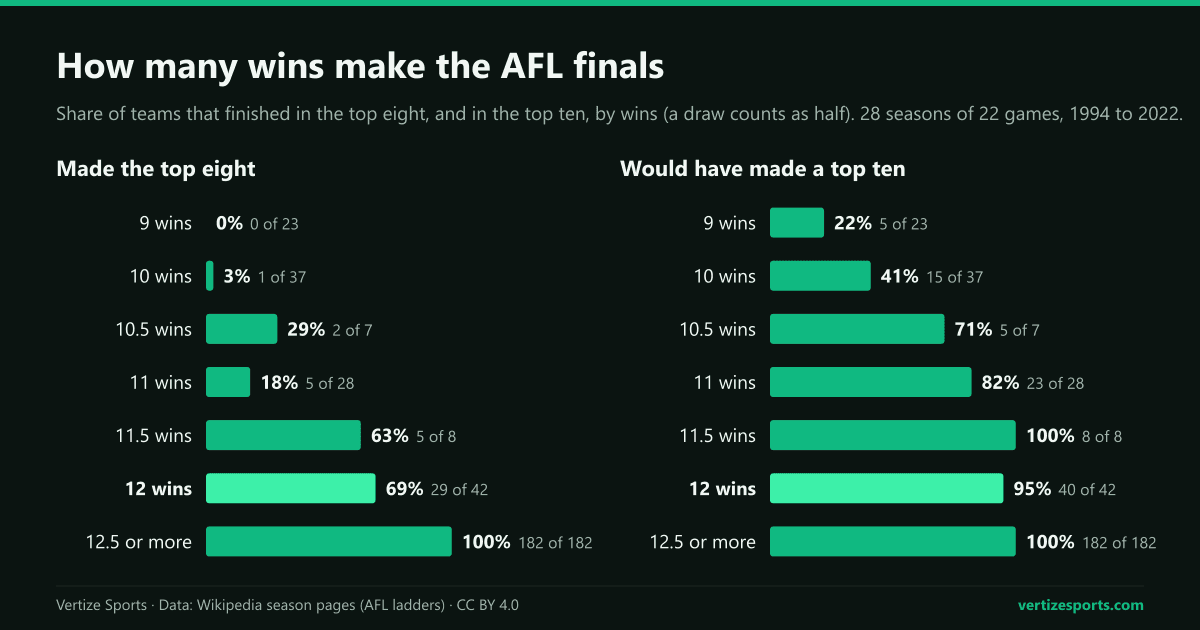
| Wins (points) | Made the top eight | Would have made a top ten |
|---|---|---|
| 9 (36) | 0 of 23 (0%) | 5 of 23 (22%) |
| 10 (40) | 1 of 37 (3%) | 15 of 37 (41%) |
| 10.5 (42) | 2 of 7 (29%) | 5 of 7 (71%) |
| 11 (44) | 5 of 28 (18%) | 23 of 28 (82%) |
| 11.5 (46) | 5 of 8 (63%) | 8 of 8 (100%) |
| 12 (48) | 29 of 42 (69%) | 40 of 42 (95%) |
| 12.5 or more (50+) | 182 of 182 (100%) | 182 of 182 (100%) |
Thirteen teams missed on 12 wins, all at 12-10 except Geelong at 11-9-1 in 2015. The worst year was 2018, when four did: North Melbourne, Port Adelaide, Essendon and Adelaide all finished on 48 points and watched Geelong take eighth at 13-9.
Most wins to miss the AFL finals, and the fewest to make it
- Western Bulldogs, 14-9 in 2025: the most wins to miss the finals on results since 1994. Gold Coast and Hawthorn took seventh and eighth at 15-8, and the Bulldogs finished ninth with the third-best percentage in the league, 137.0.
- Essendon, 14-8 in 2013: on points they would have played finals, but the AFL excluded them from the series over the club's 2012 supplements program and placed them ninth, which let Carlton in at 11-11.
- Brisbane Bears, 10-12 in 1995: the fewest wins of any finalist since 1994, and one of only three with a losing record, with the Brisbane Lions in 1997 and Essendon in 2009, both 10-11-1.
When percentage decides the last AFL finals spot
In 9 of the 32 seasons of the final eight, from 1994 to 2025, eighth and ninth finished level on premiership points and percentage, points scored divided by points conceded, decided who played finals. The latest was 2024, when Carlton, 13-10 with 110.2, finished ahead of Collingwood, 12-9-2 with 102.5.
- 2017, the closest call: West Coast pipped Melbourne for eighth on 105.7 percent to 105.2, both 12-10.
- 2022: the Western Bulldogs, 108.9, edged Carlton, 108.3, both 12-10.
- 1994 and 1998: three teams finished 12-10 on the edge of the eight, and Richmond was the one left out both times.
- 1997: the Brisbane Lions and Port Adelaide were both 10-11-1, and Brisbane's 105.2 beat Port's 91.8.
The AFL finals line, season by season
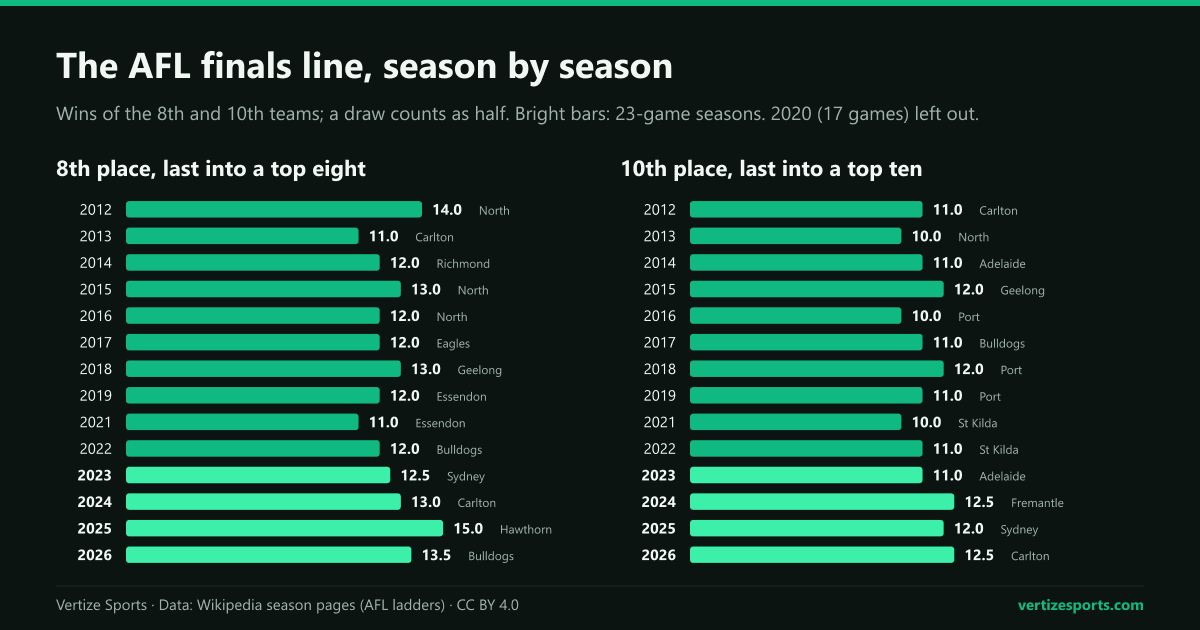
| Season | Last in (8th) | First out (9th) | 10th |
|---|---|---|---|
| 2012 | North Melbourne 14-8 | St Kilda 12-10 | Carlton 11-11 |
| 2013 | Carlton 11-11 | Essendon 14-8 | North Melbourne 10-12 |
| 2014 | Richmond 12-10 | West Coast 11-11 | Adelaide 11-11 |
| 2015 | North Melbourne 13-9 | Port Adelaide 12-10 | Geelong 11-9-1 |
| 2016 | North Melbourne 12-10 | St Kilda 12-10 | Port Adelaide 10-12 |
| 2017 | West Coast 12-10 | Melbourne 12-10 | Western Bulldogs 11-11 |
| 2018 | Geelong 13-9 | North Melbourne 12-10 | Port Adelaide 12-10 |
| 2019 | Essendon 12-10 | Hawthorn 11-11 | Port Adelaide 11-11 |
| 2020 | Collingwood 9-7-1 | Melbourne 9-8 | Greater Western Sydney 8-9 |
| 2021 | Essendon 11-11 | West Coast 10-12 | St Kilda 10-12 |
| 2022 | Western Bulldogs 12-10 | Carlton 12-10 | St Kilda 11-11 |
| 2023 | Sydney 12-10-1 | Western Bulldogs 12-11 | Adelaide 11-12 |
| 2024 | Carlton 13-10 | Collingwood 12-9-2 | Fremantle 12-10-1 |
| 2025 | Hawthorn 15-8 | Western Bulldogs 14-9 | Sydney 12-11 |
| 2026 * | Western Bulldogs 13-9-1 | Collingwood 12-9-2 | Carlton 12-10-1 |
Since the season went to 23 games in 2023, the line has been 12.5 wins, 13 and then 15, the highest of any season since 1994: in 2025 the top eight were separated from the rest by a full game, with Hawthorn eighth at 15-8. Three seasons is too few to call a new normal, but an extra game adds about half a win to the line on its own.
What the AFL final ten changes: how many wins 10th needs
From 2026, the top ten play finals: seventh hosts tenth and eighth hosts ninth in the Wildcard Round, and the two winners join the top six. Had that applied since 1994, the line would have dropped by about two wins. Tenth place had a median 10 wins in the 31 full seasons of the final eight, against 12 for eighth.
That means losing records in the finals. Tenth had more losses than wins in 18 of those 31 seasons, 58 percent, most recently Adelaide at 11-12 in 2023, and at the low end Port Adelaide in 2009 and the Western Bulldogs in 2011 would have got in at 9-13. Under a top ten, 12 wins would have been enough 40 times in 42, 95 percent, and 11 wins 23 times in 28, 82 percent.
The tie-break matters more at tenth, too. Tenth and 11th finished level on points in 16 of the 31 full seasons, 52 percent, against 9 in 32 at eighth, because the middle of the ladder is more crowded than its edge.
The 2026 line: Carlton in at 12-10-1, St Kilda first out
The first final ten did not come cheap. Carlton took the last spot at 12-10-1, 50 points, and St Kilda finished 11th at 10-13 on 40, ahead of Greater Western Sydney on percentage, 102.8 to 99.0, according to the final AFL ladder. The ten-point gap between tenth and 11th was wider than in any season of the final eight bar 2025.
Under the old top eight, the Western Bulldogs, 13-9-1, would have been the last team in, and Collingwood, 12-9-2, and Carlton would have missed. Instead both wildcard finals were set by the last round: Carlton beat Melbourne 74-55 and the Bulldogs beat Collingwood 96-93, before Geelong and Adelaide knocked them out a week later. The Brisbane Lions, third on the ladder, went on to win the premiership; how the minor premiers fared is a separate story.
The 2027 race starts from zero on the AFL ladder. To see what your club needs, the Vertize AFL ladder predictor lets you tip every game still to play, with the margin feeding percentage, and watch the top six and the wildcard places settle; out of season it replays 2026 from any round. For the same question in American leagues, we counted how many wins it takes to make the playoffs in the NFL, NBA, NHL and MLB.
AFL finals line: frequently asked questions
How many wins do you need to make the AFL top eight? About 12 in a 22-game season. Twelve wins made the eight 69 percent of the time from 1994 to 2022, and 12.5 or more always did on results.
How many wins do you need to make the AFL top ten? About 10 to 11. Tenth place had a median 10 wins in the full seasons since 1994, and in 2026, the first season of the final ten, Carlton needed 12-10-1.
What is the most wins to miss the AFL finals? Fourteen, by the Western Bulldogs at 14-9 in 2025. Essendon went 14-8 in 2013 but were excluded as a penalty.
What happens if teams finish level on points? Percentage decides it, points scored divided by points conceded, times 100. It settled eighth place in 9 of the 32 seasons from 1994 to 2025.
How this was built: the final home-and-away ladders of the 33 AFL seasons from 1994 to 2026, read from Wikipedia's season pages through the MediaWiki API on October 4, 2026, with wins, losses, draws and points for and against for every club. Each ladder was validated against its own premiership points and order, and the 2025 and 2026 ladders were cross-checked against the Squiggle API and the AFL's own reports. Medians and rates use the 28 seasons of 22 games, 1994 to 2022 without the 17-game 2020 season; the final-ten figures for earlier years are what tenth place would have needed, not what happened. Draws count as half a win, and the 2015 Adelaide-Geelong game, cancelled with two points each, counts as it did on the ladder.