We read every game since 1997 from Wikipedia's season pages, such as the 1997 AFL season, with the venue, the score and the side listed as home, and checked each club's record against the final ladder of every season. A draw counts as half a win.
AFL home win percentage by season
Home teams went 3,213-2,349-49 in the 30 seasons, 57.7 percent, and won by 7.2 points a game, a shade more than the 57.5 percent NFL home teams won from 1999 to 2018. Of the games with a winner they took 57.8 percent, just under the 58.7 percent of Premier League home sides, the highest of the six leagues whose home advantage we measured.
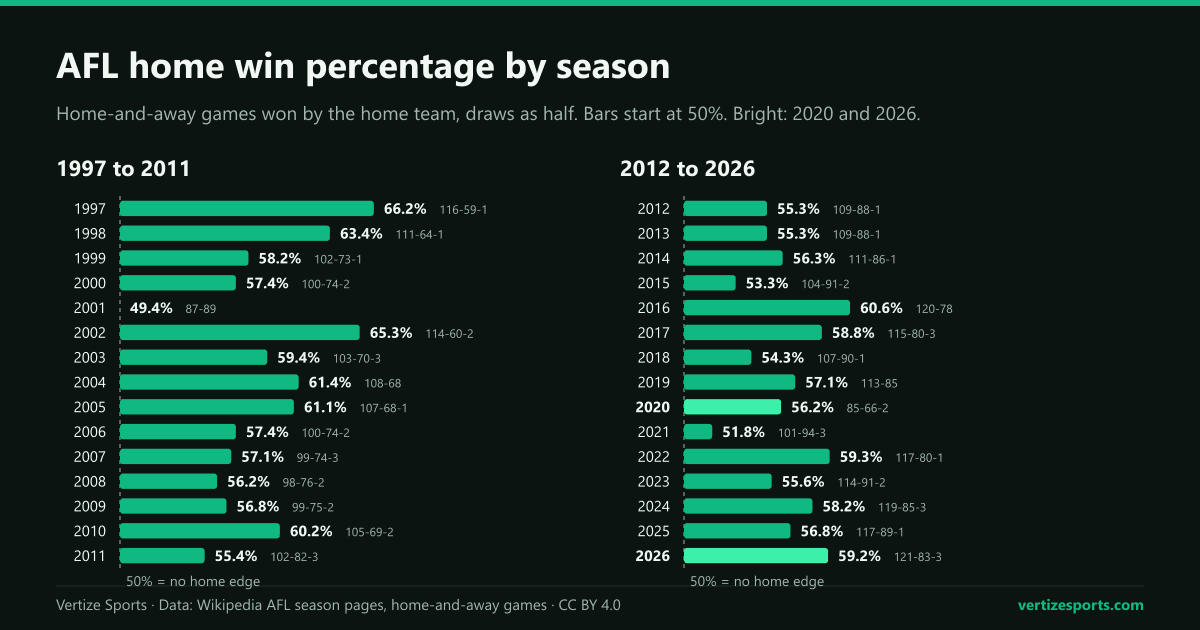
The best season for home sides was 1997, at 66.2 percent. The worst was 2001, the only one below half: home teams went 87-89, 49.4 percent.
| Season | Home record | Home win % | v interstate visitors |
|---|---|---|---|
| 1997 | 116-59-1 | 66.2% | 73.4% |
| 1998 | 111-64-1 | 63.4% | 62.0% |
| 1999 | 102-73-1 | 58.2% | 59.4% |
| 2000 | 100-74-2 | 57.4% | 58.8% |
| 2001 | 87-89 | 49.4% | 55.6% |
| 2002 | 114-60-2 | 65.3% | 72.7% |
| 2003 | 103-70-3 | 59.4% | 66.8% |
| 2004 | 108-68 | 61.4% | 67.7% |
| 2005 | 107-68-1 | 61.1% | 65.1% |
| 2006 | 100-74-2 | 57.4% | 56.8% |
| 2007 | 99-74-3 | 57.1% | 62.2% |
| 2008 | 98-76-2 | 56.3% | 61.3% |
| 2009 | 99-75-2 | 56.8% | 64.1% |
| 2010 | 105-69-2 | 60.2% | 60.6% |
| 2011 | 102-82-3 | 55.4% | 55.4% |
| 2012 | 109-88-1 | 55.3% | 60.1% |
| 2013 | 109-88-1 | 55.3% | 59.2% |
| 2014 | 111-86-1 | 56.3% | 55.8% |
| 2015 | 104-91-2 | 53.3% | 59.4% |
| 2016 | 120-78 | 60.6% | 58.0% |
| 2017 | 115-80-3 | 58.8% | 59.5% |
| 2018 | 107-90-1 | 54.3% | 52.1% |
| 2019 | 113-85 | 57.1% | 61.7% |
| 2020 | 85-66-2 | 56.2% | 62.9% |
| 2021 | 101-94-3 | 51.8% | 56.9% |
| 2022 | 117-80-1 | 59.3% | 60.1% |
| 2023 | 114-91-2 | 55.6% | 59.9% |
| 2024 | 119-85-3 | 58.2% | 59.0% |
| 2025 | 117-89-1 | 56.8% | 55.5% |
| 2026 | 121-83-3 | 59.2% | 62.3% |
Interstate travel vs shared grounds: where the edge comes from
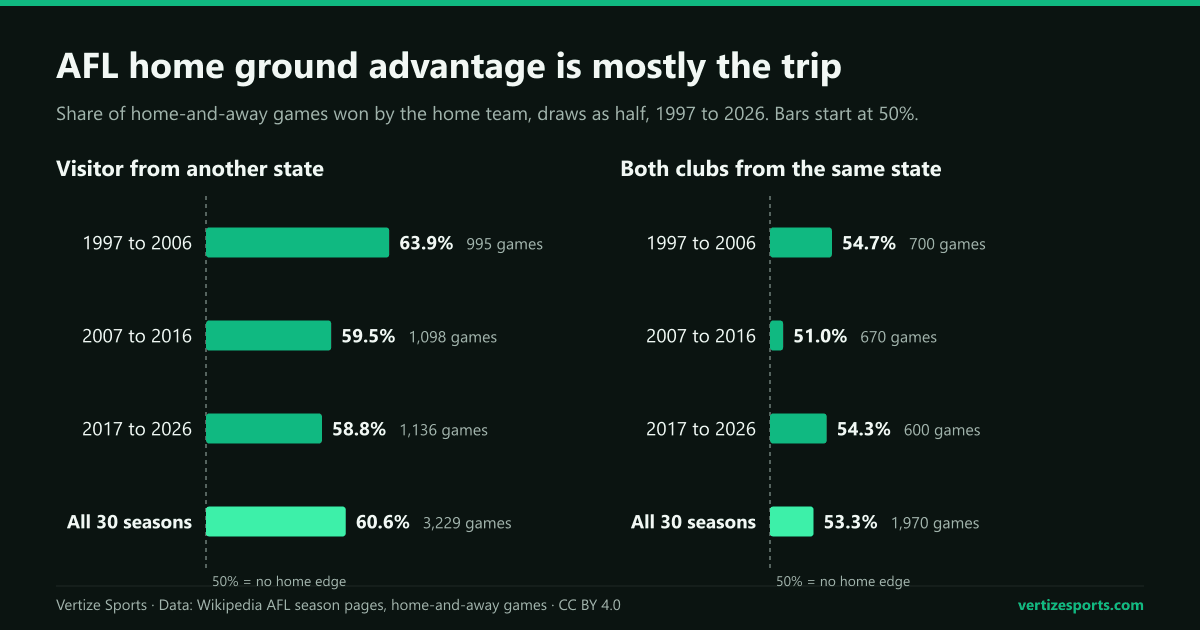
When the home club played in its own state against a club from another state, 3,229 games, it won 60.6 percent by 10.4 points a game. When both clubs came from the same state, 1,970 games, the home side won 53.3 percent by 2.3 points.
At the shared Melbourne grounds, home is mostly a label. In 1,598 Victorian-v-Victorian games at the MCG and Docklands (now Marvel Stadium), the listed home side went 808-771-19, 51.2 percent, and was outscored by 0.6 points a game. At Docklands alone home teams lost more than they won, 305-342-6; at the MCG they won 53.9 percent.
Team quality can blur raw rates, so we also took the 773 cases where two clubs from different states hosted each other once in the same season. Across each pair, the home side won by 10.7 points on average; both clubs won at home 237 times, and both won away 77 times. For the 593 same-state pairs the figure was 2.6 points, which puts the cost of crossing a state line at about 8.1 points a game.
A few grounds stand out:
- Geelong at Kardinia Park: 185-53-2, 77.5 percent, and 68-7 from 2007 to 2016.
- Hawthorn in Launceston: 67-20-1, 76.7 percent, though both clubs travel.
- North Melbourne in Hobart and Greater Western Sydney in Canberra: 19-19-2 and 20-23, no better than even.
- Derbies outside Victoria: the home side in the Western Derby went 29-30 and in the Showdown 36-23.
Is AFL home ground advantage shrinking?
Yes, and it is the interstate part that has shrunk. Against visitors from another state, home teams won 63.9 percent from 1997 to 2006 and 58.8 percent from 2017 to 2026, and the edge in return games fell from 14.1 points to 6.2. Between same-state clubs, the home record barely moved.
| Seasons | All games | Visitor from another state | Same-state clubs | Interstate edge, return games |
|---|---|---|---|---|
| 1997 to 2006 | 59.9% | 63.9% | 54.7% | +14.1 pts |
| 2007 to 2016 | 56.6% | 59.5% | 51.0% | +10.9 pts |
| 2017 to 2026 | 56.8% | 58.8% | 54.3% | +6.2 pts |
| 2022 to 2026 | 57.8% | 59.4% | 57.3% | +5.9 pts |
In the last five seasons the two have nearly met: 59.4 percent against interstate visitors, 57.3 between same-state clubs, and 5.9 points against 5.5 in return games, though the 85 same-state pairs are a small sample. The results cannot say why travel costs less than it did.
Home and away records by club: Perth and Queensland
Four clubs won at least 22 percentage points more often at home than away: Geelong, Gold Coast, Fremantle and West Coast. The two Perth clubs are near twins: West Coast won 58.9 percent at home and 36.9 away, Fremantle 59.9 and 36.8.
| Club | Home | Away | Gap (points of win %) | 2026 home |
|---|---|---|---|---|
| Geelong | 254-73-2 (77.5%) | 174-151-4 (53.5%) | 24.0 | 11-1 |
| Gold Coast | 77-98-2 (44.1%) | 36-138 (20.7%) | 23.4 | 6-5 |
| Fremantle | 197-132-1 (59.9%) | 120-207-2 (36.8%) | 23.1 | 11-0 |
| West Coast | 194-135-1 (58.9%) | 120-206-3 (36.9%) | 22.0 | 3-8 |
| Adelaide | 210-120-1 (63.6%) | 143-183-1 (43.9%) | 19.7 | 9-3 |
| Brisbane Lions | 199-127-3 (60.9%) | 135-190-5 (41.7%) | 19.3 | 8-3 |
| Port Adelaide | 207-123-2 (62.7%) | 143-181-3 (44.2%) | 18.5 | 4-8 |
| Hawthorn | 206-119-2 (63.3%) | 148-179-5 (45.3%) | 18.0 | 9-2-1 |
| Richmond | 172-151-6 (53.2%) | 120-207-3 (36.8%) | 16.4 | 2-9 |
| Greater Western Sydney | 91-72-1 (55.8%) | 64-98-3 (39.7%) | 16.1 | 8-4 |
| Essendon | 178-147-3 (54.7%) | 129-198-4 (39.6%) | 15.2 | 2-10 |
| St Kilda | 175-148-6 (54.1%) | 137-192-1 (41.7%) | 12.4 | 4-7 |
| Sydney | 216-111-2 (66.0%) | 177-149-4 (54.2%) | 11.7 | 11-1 |
| North Melbourne | 166-160-4 (50.9%) | 129-199-1 (39.4%) | 11.5 | 6-6 |
| Melbourne | 158-169-3 (48.3%) | 123-205-1 (37.5%) | 10.8 | 8-3 |
| Western Bulldogs | 183-141-5 (56.4%) | 156-173-1 (47.4%) | 9.0 | 6-4-1 |
| Carlton | 142-184-2 (43.6%) | 124-203-4 (38.1%) | 5.5 | 7-4 |
| Collingwood | 188-139-3 (57.4%) | 171-154-4 (52.6%) | 4.8 | 6-5-1 |
The Brisbane Lions won 60.9 percent at home and 41.7 away, and went 196-127-3 at the Gabba. Sydney had the second-best home record, 66.0 percent, and the best away record, 54.2, so its gap was among the smallest. The smallest belonged to Collingwood, which plays its biggest away games at its own ground, the MCG.
The ground matters less than the team. West Coast won 65.5 percent of home games at Subiaco until 2017 and 42.6 at Perth Stadium since 2018: 29-10 in its first four seasons there, 11-44 since 2022 as the club fell down the ladder. Fremantle went 60-33-1 at the new ground.
The 2020 hub season as a natural experiment
In 2020 the AFL cut the season to 17 games a club, and after Round 5 all 10 Victorian clubs left the state as COVID-19 cases rose in Victoria. From Round 6 on, not one of the season's 109 remaining games was played in Victoria; 45 of the Victorian clubs' 58 listed home games were played in Queensland.
Victorian clubs went 30-28 in those games, 51.7 percent. Clubs that still hosted games in their own state went 22-16-1, 57.7 percent. Over the whole season home teams won 56.2 percent, near the long-run figure, because the first five rounds, played at normal grounds, went 26-17-1 to the hosts.
The grand final moved too. Richmond beat Geelong 81-50 at the Gabba in the first grand final held outside Victoria, and a year later Perth Stadium hosted the decider while Victoria was in lockdown; Melbourne beat the Western Bulldogs 140-66.
AFL finals: home ground advantage in September
Leaving out grand finals, the home team won 167 of 242 finals since 1997, 69.0 percent. That is not all home ground: the higher-placed club hosts, so the home side is usually the better one. Travel added nothing visible, with hosts winning 67.9 percent against visitors from another state and 69.6 percent against clubs from their own state.
The grand final was played at the MCG 29 times out of 31 since 1997, counting the 2010 draw and replay. In the 17 MCG grand finals between a Victorian club and a club from another state, the Victorian club won 9, barely half.
Home ground advantage in the 2026 AFL season
In 2026, home teams went 121-83-3 in the home-and-away season, 59.2 percent, by 7.1 points a game: the 10th-best season of the 30 and the highest since 2022. Against interstate visitors they won 62.3 percent; between same-state clubs, 51.5. Round 5 was Gather Round, with all nine games in South Australia, at Adelaide Oval, Norwood Oval and Barossa Park.
- Fremantle went 11-0 at Perth Stadium, its first unbeaten home season since at least 1997 and one of 13 by any club in that time; Geelong has five.
- Sydney and Geelong went 11-1 at home; Adelaide went 9-3.
- Essendon won 2 of 12 home games and Richmond 2 of 11, and West Coast went 3-8.
- The premiers travelled well: the Brisbane Lions went 8-3 at home and 8-4 away.
In the first finals series with a wildcard round, home teams won 6 of the 10 finals before the grand final. Fremantle lost a qualifying final at home to Hawthorn, beat Geelong there and won a preliminary final at the SCG, before the Brisbane Lions beat them 96-89 at the MCG for a third straight premiership.
The 2027 season starts from scratch on the AFL ladder. The AFL fixture shows where every game is played, and the AFL ladder predictor replays 2026 from any round, tipping every game. For where a ladder spot leads, see how minor premiers fare in September.
AFL home ground advantage: frequently asked questions
How much is home ground advantage worth in the AFL? Home teams won 57.7 percent of home-and-away games from 1997 to 2026, by 7.2 points a game. Against interstate visitors it was 60.6 percent and about 10.7 points.
Is there home ground advantage when Victorian clubs share the MCG? Very little. In Victorian-v-Victorian games at the MCG and Docklands, the listed home side won 51.2 percent.
Which AFL club has the best home record? Geelong, 254-73-2 at home since 1997, 77.5 percent, and 185-53-2 at Kardinia Park.
Did home ground advantage disappear in the 2020 hub season? For Victorian clubs it did: after they left the state, they won 51.7 percent of their listed home games.
How this was built: every AFL home-and-away and finals game from 1997 to 2026, 5,611 and 273, read from Wikipedia's season pages through the MediaWiki API, with scores, venues and the home side as listed in the fixture. Every club's wins, losses and draws match the final ladder of each season; points totals differ by up to six for a few clubs in 2005, 2006 and 2017. Games are classed by the state of the ground and of each club; the ACT, Tasmania, the Northern Territory and overseas are nobody's home state. Cancelled games are left out.