We rebuilt all 33 lotteries from 1994 to 2026 seed by seed and computed the exact odds of every pick under both systems. Results have tracked the odds; what changed in 2019 is where the worst teams land.
NBA draft lottery odds by seed
From 1994 to 2018, 1,000 four-ball combinations were split among the non-playoff teams, with 250 for the worst record, and three picks were drawn. The worst team had a 25.0 percent chance at No. 1 and a 64.3 percent chance at a top-three pick; its expected pick was 2.6th.
For the 2019 draft the NBA gave the three worst teams 14 percent each, drew four picks instead of three and let the worst team fall as far as fifth. Its chance of a top-four pick is 52.1 percent, its expected pick 3.7th, and every seed can now drop four places.
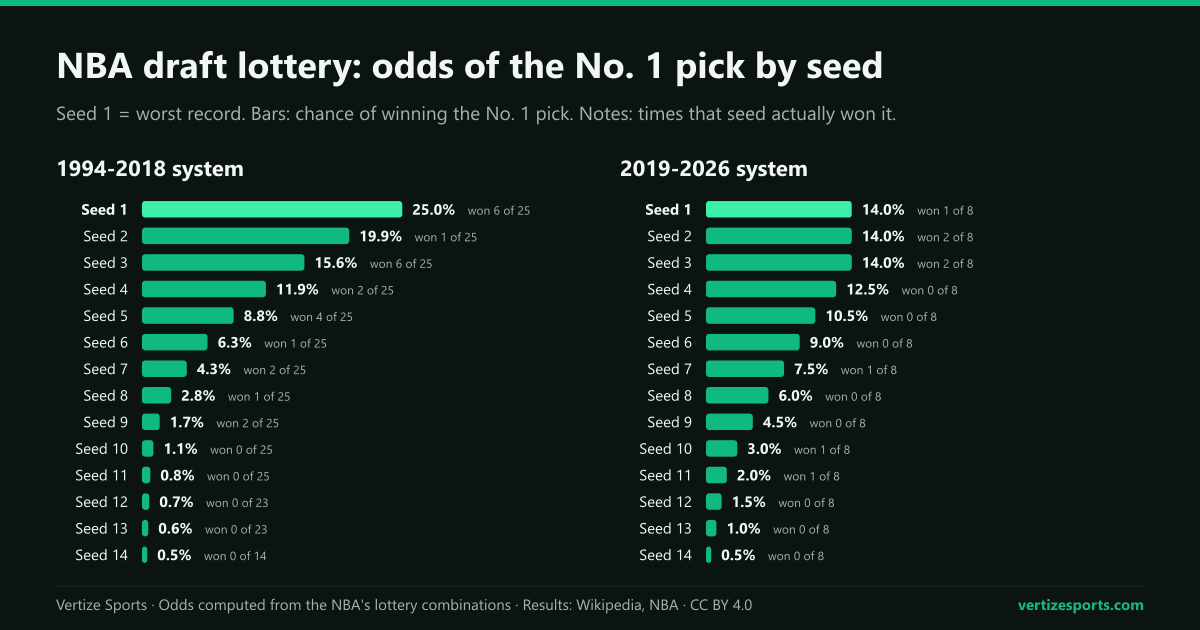
| Seed | 1994-2018: No. 1 odds | Won No. 1 | 2019-2026: No. 1 odds | Won No. 1 | Lowest pick, 2019-2026 |
|---|---|---|---|---|---|
| 1 | 25.0% | 6 of 25 | 14.0% | 1 of 8 | 5 |
| 2 | 19.9% | 1 of 25 | 14.0% | 2 of 8 | 6 |
| 3 | 15.6% | 6 of 25 | 14.0% | 2 of 8 | 7 |
| 4 | 11.9% | 2 of 25 | 12.5% | 0 of 8 | 8 |
| 5 | 8.8% | 4 of 25 | 10.5% | 0 of 8 | 9 |
| 6 | 6.3% | 1 of 25 | 9.0% | 0 of 8 | 10 |
| 7 | 4.3% | 2 of 25 | 7.5% | 1 of 8 | 11 |
| 8 | 2.8% | 1 of 25 | 6.0% | 0 of 8 | 12 |
| 9 | 1.7% | 2 of 25 | 4.5% | 0 of 8 | 13 |
| 10 | 1.1% | 0 of 25 | 3.0% | 1 of 8 | 14 |
| 11 | 0.8% | 0 of 25 | 2.0% | 1 of 8 | 14 |
| 12 | 0.7% | 0 of 23 | 1.5% | 0 of 8 | 14 |
| 13 | 0.6% | 0 of 23 | 1.0% | 0 of 8 | 14 |
| 14 | 0.5% | 0 of 14 | 0.5% | 0 of 8 | 14 |
How often the worst record gets the No. 1 pick
The worst team won 6 of the 25 lotteries from 1994 to 2018, right on its 25 percent odds: the Cleveland Cavaliers in 2003, when they were tied for the worst record with the Denver Nuggets, the Orlando Magic in 2004, then four years in a row from 2015 to 2018. Two of the misses came in 1996 and 1997, when the worst team was the expansion Vancouver Grizzlies, who were not allowed to pick first.
Since 2019 it has won once in eight lotteries, close to its 14 percent. The bigger change is the floor. The worst team fell to fifth three times, the Detroit Pistons in 2023 and 2024 and the Utah Jazz in 2025, and its average pick went from 2.3 to 3.3.
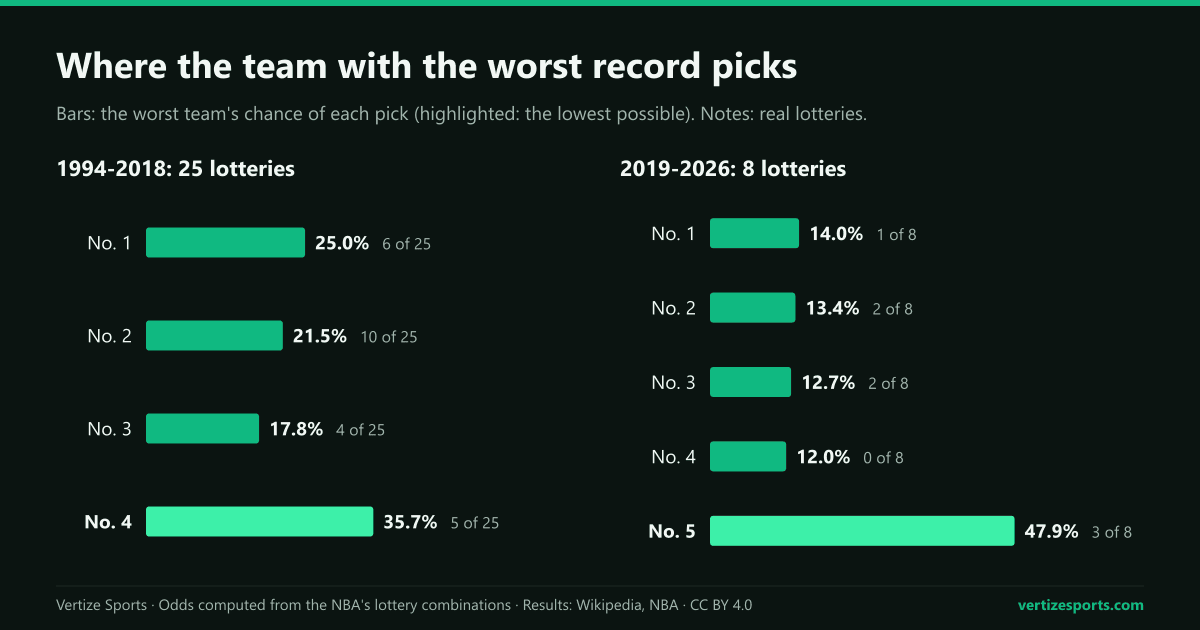
The three worst records won the No. 1 pick 13 times in 25 under the old system, against 60.5 percent on paper, and 5 times in 8 since 2019, against 42.0 percent. Under the old odds the second-worst team won it only once, the 1996 Philadelphia 76ers, and fell to fourth 12 times.
Where lottery seeds end up: falling to fifth and sixth
Under the current format the three worst teams have shared 24 places in eight lotteries, and 12 of them ended at fifth or sixth, against 10.9 expected. In no year have all three stayed in the top four, an outcome with a 9.5 percent chance each year. Under the old system the three worst took the top three picks twice in 25 years, against 9.9 percent: in 1996, and in 2016, when the 76ers, Los Angeles Lakers and Brooklyn Nets went 1-2-3 and the lottery order matched the standings exactly.
- Seed 1 since 2019: No. 1 once, No. 2 twice, No. 3 twice, No. 5 three times.
- Seed 2 since 2019: No. 1 twice (Detroit in 2021, Orlando in 2022), No. 2 and No. 4 once each, No. 5 three times, No. 6 once.
- Seed 3 since 2019: No. 1 twice (Minnesota in 2020, San Antonio in 2023), No. 4 once, No. 5 twice, No. 6 three times.
- Seed 1 from 1994 to 2018: top three in 20 of 25 years and fourth in the other five (1997, 2001, 2006, 2007, 2009).
Flatter odds also spread the top pick: three of the eight winners since 2019 came from the seventh seed or lower, against 26.0 percent expected; from 1994 to 2018 it was 5 of 25, against 12.5 percent, and no team won from lower than ninth.
Biggest NBA draft lottery jumps
The longest odds ever overcome belong to the 1993 Orlando Magic, who at 41-41 held 1 of 66 chances, 1.52 percent, and won the No. 1 pick a year after taking Shaquille O'Neal. They picked Chris Webber and traded him on draft night, and the NBA moved to the 1,000-combination system with 25 percent for the worst team for the next draft. Since 1994:
- 2008 Chicago Bulls: ninth seed, 1.7 percent, took Derrick Rose.
- 2014 Cleveland Cavaliers: ninth seed, 1.7 percent, took Andrew Wiggins.
- 2025 Dallas Mavericks: 11th seed, 1.8 percent, took Cooper Flagg; at 10 places, the longest climb.
- 2011 Cleveland Cavaliers, with the Los Angeles Clippers' pick: eighth seed, 2.8 percent, took Kyrie Irving.
- 2024 Atlanta Hawks: 10th seed, 3.0 percent, took Zaccharie Risacher.
- 2019 New Orleans Pelicans: seventh seed, 6.0 percent, took Zion Williamson; the Lakers climbed from 11th to fourth.
- 1999 Charlotte Hornets: 13th of 13, the best record in the lottery, moved up to third.
Every NBA draft lottery winner since 1994
| Draft | Won the No. 1 pick | Seed | Chance | Worst team, pick |
|---|---|---|---|---|
| 1994 | Bucks (Glenn Robinson) | 4 of 11 | 16.3% | Mavericks, No. 2 |
| 1995 | Warriors (Joe Smith) | 5 of 11 | 9.4% | Clippers, No. 2 |
| 1996 | 76ers (Allen Iverson) | 2 of 13 | 33.7% | Grizzlies, No. 3 |
| 1997 | Spurs (Tim Duncan) | 3 of 13 | 21.6% | Grizzlies, No. 4 |
| 1998 | Clippers (Michael Olowokandi) | 3 of 13 | 22.6% | Nuggets, No. 3 |
| 1999 | Bulls (Elton Brand) | 3 of 13 | 15.7% | Grizzlies, No. 2 |
| 2000 | Nets (Kenyon Martin) | 7 of 13 | 4.4% | Clippers, No. 3 |
| 2001 | Wizards (Kwame Brown) | 3 of 13 | 15.7% | Bulls, No. 4 |
| 2002 | Rockets (Yao Ming) | 5 of 13 | 8.9% | Bulls, No. 2 |
| 2003 | Cavaliers (LeBron James) | 1 of 13 | 22.5% | Cavaliers, No. 1 |
| 2004 | Magic (Dwight Howard) | 1 of 13 | 25.0% | Magic, No. 1 |
| 2005 | Bucks (Andrew Bogut) | 6 of 14 | 6.3% | Hawks, No. 2 |
| 2006 | Raptors (Andrea Bargnani) | 5 of 14 | 8.8% | Trail Blazers, No. 4 |
| 2007 | Trail Blazers (Greg Oden) | 7 of 14 | 5.3% | Grizzlies, No. 4 |
| 2008 | Bulls (Derrick Rose) | 9 of 14 | 1.7% | Heat, No. 2 |
| 2009 | Clippers (Blake Griffin) | 3 of 14 | 17.7% | Kings, No. 4 |
| 2010 | Wizards (John Wall) | 5 of 14 | 10.3% | Nets, No. 3 |
| 2011 | Clippers' pick, held by Cleveland (Kyrie Irving) | 8 of 14 | 2.8% | Timberwolves, No. 2 |
| 2012 | Hornets (Anthony Davis) | 4 of 14 | 13.7% | Bobcats, No. 2 |
| 2013 | Cavaliers (Anthony Bennett) | 3 of 14 | 15.6% | Magic, No. 2 |
| 2014 | Cavaliers (Andrew Wiggins) | 9 of 14 | 1.7% | Bucks, No. 2 |
| 2015 | Timberwolves (Karl-Anthony Towns) | 1 of 14 | 25.0% | Timberwolves, No. 1 |
| 2016 | 76ers (Ben Simmons) | 1 of 14 | 25.0% | 76ers, No. 1 |
| 2017 | Nets' pick, held by Boston (Markelle Fultz) | 1 of 14 | 25.0% | Nets, No. 1 |
| 2018 | Suns (Deandre Ayton) | 1 of 14 | 25.0% | Suns, No. 1 |
| 2019 | Pelicans (Zion Williamson) | 7 of 14 | 6.0% | Knicks, No. 3 |
| 2020 | Timberwolves (Anthony Edwards) | 3 of 14 | 14.0% | Warriors, No. 2 |
| 2021 | Pistons (Cade Cunningham) | 2 of 14 | 14.0% | Rockets, No. 2 |
| 2022 | Magic (Paolo Banchero) | 2 of 14 | 14.0% | Rockets, No. 3 |
| 2023 | Spurs (Victor Wembanyama) | 3 of 14 | 14.0% | Pistons, No. 5 |
| 2024 | Hawks (Zaccharie Risacher) | 10 of 14 | 3.0% | Pistons, No. 5 |
| 2025 | Mavericks (Cooper Flagg) | 11 of 14 | 1.8% | Jazz, No. 5 |
| 2026 | Wizards (AJ Dybantsa) | 1 of 14 | 14.0% | Wizards, No. 1 |
2026 NBA draft lottery results and the 3-2-1 format
The last lottery under the 14 percent system was drawn on May 10 at Navy Pier in Chicago. The Wizards, 17-65 and seeded first, won it and took AJ Dybantsa; our look at every No. 1 pick covers how top picks have turned out. Utah climbed from fourth to second, Memphis from sixth to third and Chicago, with the ninth-best odds, to fourth, while Indiana's pick fell to fifth and went to the Clippers.
On May 28 the Board of Governors approved the 3-2-1 Lottery for the 2027, 2028 and 2029 drafts. It expands the lottery from 14 to 16 teams and draws all 16 picks:
- Teams that miss the playoffs and the play-in get three balls, except the three worst records, which are draft relegated and get two.
- The ninth and 10th play-in seeds in each conference get two balls, and the losers of the 7-8 play-in games get one.
- With 37 balls in all, a three-ball team has an 8.1 percent chance at No. 1 and a relegated team 5.4 percent, against 14 percent in 2026 and 25 percent before 2019.
- A relegated team can fall no lower than 12th; the other lottery teams can drop to 16th.
- No team's pick can go first in two consecutive drafts or land in the top five three drafts in a row.
The 2026-27 season opens on Oct. 20, and its standings will set the first 3-2-1 lottery. The NBA schedule lists every game, our season simulator plays out the standings and our projected wins for every team show who is headed for the lottery.
NBA draft lottery odds: frequently asked questions
What were the NBA draft lottery odds for the worst team? From 2019 to 2026, 14.0 percent at No. 1 and 47.9 percent of falling to fifth. Under the 3-2-1 format that starts in 2027, the three worst teams have 5.4 percent each.
How often has the worst team won the NBA draft lottery? Seven times in 33 lotteries since 1994: 6 of 25 under the 1994-2018 odds and once since 2019, the 2026 Wizards.
What is the biggest jump in NBA draft lottery history? By odds, the 1993 Orlando Magic, at 1.52 percent. By places, the 2025 Dallas Mavericks, from 11th to first.
When does the new NBA draft lottery format start? With the 2027 draft, after the 2026-27 season, and it runs through 2029.
How this was built: we computed the exact probability of every pick for each seed by enumerating every possible draw, using the NBA's 250-199-156-119-88-63-43-28-17-11-8-7-6-5 combinations (2005-2018) and 140-140-140-125-105-90-75-60-45-30-20-15-10-5 (2019-2026). Lottery results for 2003 and 2006-2026 come from the lottery tables on Wikipedia's draft pages; for 1994-2005 we rebuilt the order from NBA.com's official standings and Wikipedia's draft selections, with ties settled by the draft order. 2020 used records at the March suspension. 2026 results and 3-2-1 rules: NBA Communications. Lotteries 1994 to 2026.