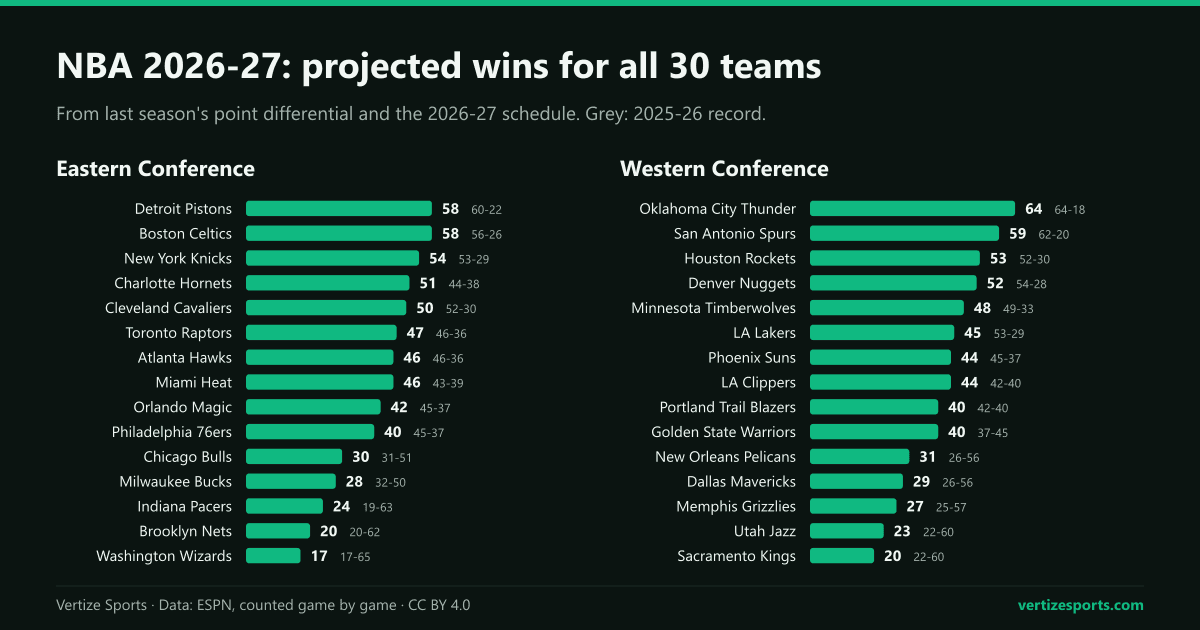
The 2026-27 season tips off on Tuesday, October 20, with a tripleheader on NBC: the Celtics at the Pistons at 3 p.m. ET, the 76ers at the champion Knicks at 7 p.m. and the Thunder at the Spurs at 9:30 p.m. The last of those is a rematch of the Western Conference finals, which San Antonio won 111-103 in Game 7 before losing the NBA Finals to New York in five games. Jalen Brunson was the unanimous Finals MVP.
Before a single game is played, we ran the full schedule through the model that powers the simulator. It produces a projected win total for every team, and it is worth reading for two reasons: what it says, and what it cannot possibly know.
How the predictor rates a team
Each team gets one number: its point differential per game last season. The Thunder outscored opponents by 11.1 points a night, the best mark in the league. The Wizards were outscored by 12.0, the worst.
The win-loss record is left out on purpose. Close games turn on a handful of possessions and tend not to repeat from one season to the next, while the margin a team wins or loses by is a steadier measure of how good it actually is.
Every game is then simulated the same way. The home team starts 1.7 points ahead, the measured home-court edge in the NBA, and each point of last season's differential is worth about one point of expected margin, so a team that was five points a game better than its opponent is expected to beat it by five, plus home court. The rest is randomness: real NBA results scatter by around 14 points either side of what the numbers expect. Two evenly matched teams give the home side a win about 55 percent of the time. When the Thunder host the Wizards, the best team by this measure against the worst, the home side wins 96 percent of the time.
The projections below are averages: the win total a team lands on across many simulated seasons. They are built on the 80 games per team already on the calendar and scaled to 82, because the last two for each team are only scheduled once the NBA Cup knockout field is known. A single run of the simulator will land a few wins above or below.
Projected wins: Eastern Conference
| Team | Projected wins | 2025-26 record |
|---|---|---|
| Detroit Pistons | 58 | 60-22 |
| Boston Celtics | 58 | 56-26 |
| New York Knicks | 54 | 53-29 |
| Charlotte Hornets | 51 | 44-38 |
| Cleveland Cavaliers | 50 | 52-30 |
| Toronto Raptors | 47 | 46-36 |
| Atlanta Hawks | 46 | 46-36 |
| Miami Heat | 46 | 43-39 |
| Orlando Magic | 42 | 45-37 |
| Philadelphia 76ers | 40 | 45-37 |
| Chicago Bulls | 30 | 31-51 |
| Milwaukee Bucks | 28 | 32-50 |
| Indiana Pacers | 24 | 19-63 |
| Brooklyn Nets | 20 | 20-62 |
| Washington Wizards | 17 | 17-65 |
Projected wins: Western Conference
| Team | Projected wins | 2025-26 record |
|---|---|---|
| Oklahoma City Thunder | 64 | 64-18 |
| San Antonio Spurs | 59 | 62-20 |
| Houston Rockets | 53 | 52-30 |
| Denver Nuggets | 52 | 54-28 |
| Minnesota Timberwolves | 48 | 49-33 |
| Los Angeles Lakers | 45 | 53-29 |
| Phoenix Suns | 44 | 45-37 |
| LA Clippers | 44 | 42-40 |
| Golden State Warriors | 40 | 37-45 |
| Portland Trail Blazers | 40 | 42-40 |
| New Orleans Pelicans | 31 | 26-56 |
| Dallas Mavericks | 29 | 26-56 |
| Memphis Grizzlies | 27 | 25-57 |
| Utah Jazz | 23 | 22-60 |
| Sacramento Kings | 20 | 22-60 |
Where the model disagrees with last season's record
The two biggest gaps between a record and a projection point in opposite directions. The Hornets finished 44-38, but they outscored opponents by 4.8 points a game, a margin that normally comes with more wins, and the model has them at 51. The Lakers finished 53-29 on a differential of just +1.8, which is the profile of a team that won its close games, and the model has them at 45.
Both teams then changed the picture on their own. Charlotte traded LaMelo Ball and Josh Green to Minnesota for Naz Reid and a stack of draft picks. The Lakers lost LeBron James in free agency and brought in center Walker Kessler from Utah in a four-year, $130 million sign-and-trade.
What the model cannot see
The ratings were set when the last regular season ended, and nothing since is in them: not the playoffs, and not the trades of June, July and August. It was a summer in which several of the league's biggest names changed teams, and these are the moves that most change the numbers above.
- Philadelphia 76ers (projected 40): traded Paul George, two first-round picks and two second-round picks to Boston for Jaylen Brown, then signed LeBron James to a two-year minimum deal he called his last decision. The model is still rating a team that was outscored by 0.2 points a game.
- Miami Heat (projected 46): landed Giannis Antetokounmpo and Bobby Portis from Milwaukee, sending back Tyler Herro, Kel'el Ware, Jaime Jaquez Jr., Kasparas Jakucionis and three first-round picks.
- Milwaukee Bucks (projected 28): that number comes from a 32-50 team that still had Antetokounmpo.
- Boston Celtics (projected 58): level with Detroit at the top of the East on paper, but Brown is gone and George takes his place.
- Toronto Raptors (projected 47): Kawhi Leonard is back. The trade was completed in mid-September, once the league closed its salary-cap investigation into the Clippers, and sent Brandon Ingram and Gradey Dick the other way.
- LA Clippers (projected 44): Ingram and Dick arrive in place of Leonard.
- Minnesota Timberwolves (projected 48): added Ball and Green from Charlotte, while Julius Randle left for Brooklyn in the same four-team deal.
- Portland Trail Blazers (projected 40): sent Jerami Grant and Kris Murray to Memphis for Ja Morant.
- Washington Wizards (projected 17): the lowest rating in the league, and the No. 1 pick in the draft, AJ Dybantsa.
Overrule it: how to use the simulator
This is where the simulator is more useful than any single projection. It starts from the same ratings, but every game is yours to change. Type a score into any game and both conferences reorder as you go: the top six go straight to the playoffs, seventh to tenth go to the play-in, and the rest are done in April.
- Press Simulate season to fill every game with the model and watch a whole season play out. Run it again and it comes out differently.
- Use Simulate night to go one night at a time, moving through the calendar month by month.
- Give the 76ers the games you think LeBron James and Jaylen Brown will swing, and see where they finish in the East.
- Do the same for Miami with Antetokounmpo, then check what it does to the teams around them.
- Once the season starts, finished games lock in with their real scores. From then on you are not predicting the season, you are finishing it.
- Clear wipes your scores so you can start again.
Dates to circle
- October 20: opening night. Celtics at Pistons (3 p.m. ET), 76ers at Knicks (7 p.m.) and Thunder at Spurs (9:30 p.m.), all on NBC.
- October 30 to November 27: NBA Cup group play on Friday Cup Nights, plus Tuesday, November 24 and Wednesday, November 25.
- December 11: the NBA Cup final at Hinkle Fieldhouse in Indianapolis, the first one played outside Las Vegas.
- December 25: five Christmas games. Spurs at Knicks (noon ET), Heat at Celtics (2:30 p.m.), 76ers at Lakers (5 p.m.) in LeBron James's first game back in Los Angeles, Thunder at Timberwolves (8 p.m.) and Nuggets at Warriors (10:30 p.m.).
- February 19 to 21, 2027: All-Star Weekend in Phoenix.
- April 11, 2027: the last day of the regular season, with all 30 teams in action.
The projections use a single input, last season's point differential, and nothing else: no trades, no injuries, no rookies. That is not a flaw to hide. It is the part of the forecast left to you.