We added up the league's team box scores for every regular season from 1997 to 2026, 6,493 games in all, to measure how much WNBA teams score, how they score and how fast they play. Every figure is per team per game unless stated otherwise.
WNBA points per game by season, 1997 to 2026
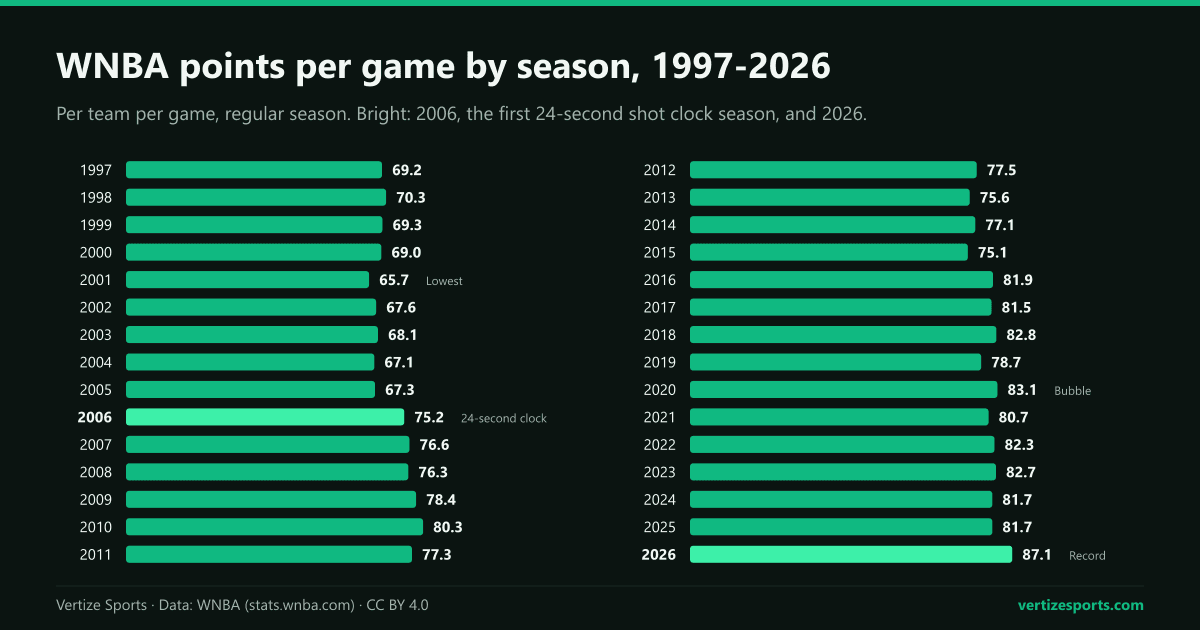
Scoring has moved in steps rather than a steady climb. From 1997 to 2005 no season averaged more than 70.3 points per team. Since 2006, when the league switched to four 10-minute quarters and a 24-second shot clock, no season has averaged fewer than 75.1, and 2026 went well past the old high.
| Season | Points | 3-pointers | 3-pt share | Free throws | Pace | Per 100 |
|---|---|---|---|---|---|---|
| 2026 | 87.1 | 8.7 / 25.5 | 37.2% | 16.3 / 20.8 | 83.1 | 104.8 |
| 2025 | 81.7 | 8.2 / 24.2 | 36.0% | 14.3 / 18.2 | 80.9 | 101.0 |
| 2024 | 81.7 | 7.7 / 22.8 | 33.5% | 14.2 / 18.0 | 82.3 | 99.3 |
| 2023 | 82.7 | 7.7 / 22.1 | 32.3% | 14.8 / 18.5 | 82.7 | 100.1 |
| 2022 | 82.3 | 7.7 / 22.4 | 32.9% | 14.4 / 18.2 | 82.4 | 99.8 |
| 2021 | 80.7 | 7.3 / 21.2 | 30.9% | 14.0 / 17.3 | 81.8 | 98.6 |
| 2020 | 83.1 | 7.3 / 21.2 | 31.0% | 14.9 / 18.4 | 82.7 | 100.5 |
| 2019 | 78.7 | 6.8 / 20.0 | 29.2% | 13.7 / 17.3 | 81.6 | 96.5 |
| 2018 | 82.8 | 6.7 / 19.5 | 28.4% | 14.8 / 18.6 | 81.6 | 101.5 |
| 2017 | 81.5 | 5.9 / 17.5 | 25.7% | 15.6 / 19.6 | 81.6 | 99.8 |
| 2016 | 81.9 | 5.4 / 16.1 | 23.8% | 16.9 / 21.2 | 81.5 | 100.5 |
| 2015 | 75.1 | 4.8 / 14.8 | 22.6% | 14.8 / 18.6 | 78.5 | 95.7 |
| 2014 | 77.1 | 4.6 / 14.1 | 21.2% | 14.5 / 18.6 | 79.4 | 97.1 |
| 2013 | 75.6 | 4.7 / 14.4 | 21.6% | 14.7 / 18.9 | 79.3 | 95.4 |
| 2012 | 77.5 | 6.2 / 17.7 | 26.6% | 14.1 / 18.5 | 80.3 | 96.6 |
| 2011 | 77.3 | 5.6 / 15.8 | 24.1% | 14.5 / 18.8 | 79.6 | 97.1 |
| 2010 | 80.3 | 5.9 / 16.8 | 25.3% | 15.9 / 20.6 | 81.2 | 98.9 |
| 2009 | 78.4 | 5.6 / 16.2 | 24.5% | 16.1 / 20.8 | 81.3 | 96.4 |
| 2008 | 76.3 | 5.3 / 15.6 | 23.9% | 16.3 / 21.6 | 80.3 | 94.9 |
| 2007 | 76.6 | 5.5 / 15.9 | 24.1% | 15.8 / 20.3 | 81.0 | 94.6 |
| 2006 | 75.2 | 5.1 / 15.1 | 23.5% | 15.4 / 20.5 | 79.1 | 95.1 |
| 2005 | 67.3 | 4.0 / 11.9 | 20.5% | 14.1 / 19.1 | 71.6 | 94.0 |
| 2004 | 67.1 | 4.3 / 12.2 | 20.9% | 13.8 / 18.6 | 71.6 | 93.7 |
| 2003 | 68.1 | 4.6 / 13.6 | 22.7% | 13.7 / 18.4 | n/a | n/a |
| 2002 | 67.6 | 4.5 / 13.1 | 22.4% | 14.0 / 18.8 | 71.4 | 94.7 |
| 2001 | 65.7 | 4.3 / 12.9 | 22.1% | 13.3 / 17.9 | 71.1 | 92.5 |
| 2000 | 69.0 | 4.2 / 12.7 | 21.7% | 14.5 / 19.6 | n/a | n/a |
| 1999 | 69.3 | 4.3 / 13.4 | 22.5% | 14.8 / 20.3 | 73.7 | 94.0 |
| 1998 | 70.3 | 3.7 / 11.8 | 19.4% | 15.0 / 20.9 | 76.4 | 92.0 |
| 1997 | 69.2 | 3.8 / 12.0 | 19.6% | 14.6 / 20.5 | n/a | n/a |
The highest-scoring WNBA seasons, and the lowest
The five highest-scoring seasons have all come since 2018: 2026 (87.1), 2020 (83.1), 2018 (82.8), 2023 (82.7) and 2022 (82.3). The five lowest all came from 2001 to 2005, led by 2001 at 65.7. The biggest one-season drop came in 2019, when scoring fell 4.1 points, from 82.8 to 78.7.
WNBA rule changes that line up with scoring shifts
The largest one-season rise came in 2006, when scoring went from 67.3 points to 75.2. That season the WNBA replaced two 20-minute halves with four 10-minute quarters and cut the shot clock from 30 seconds to 24, as Wikipedia's summary of the league's rule changes records; both rules are still in the 2026 WNBA rule book. The timing does not prove the cause, but the shape fits a faster game: possessions rose from 71.6 to 79.1 a game while points per 100 possessions barely moved, from 94.0 to 95.1, so about 7.0 of the 7.9 extra points came from extra possessions.
Other changes line up with later shifts:
- 2007: teams got 8 seconds instead of 10 to bring the ball past half court, and pace rose again, to 81.0 possessions a game.
- 2013: the league moved the three-point line out to 22 feet 1.75 inches, the international distance, and scoring dipped from 77.5 to 75.6.
- 2020: the 22-game season was played without fans at IMG Academy in Bradenton, Florida, and it produced 83.1 points a game, the highest average until 2026.
The next two biggest rises were different. In 2016, when scoring went from 75.1 to 81.9, and in 2026, more than half of the gain came from scoring more on each possession rather than from playing faster. Both seasons also brought a jump in free throws, from 18.6 attempts a game to 21.2 in 2016 and from 18.2 to 20.8 in 2026.
WNBA three-pointers per game by season
In 1997 teams attempted 12.0 three-pointers a game and made 3.8; in 2026 they attempted 25.5 and made 8.7, both records. Threes went from 19.6 percent of all shots to 37.2 percent. Accuracy did not drive the rise: the league has made between 31.4 percent (1998) and 35.3 percent (2011 and 2012) of its threes every season, and 34.0 percent in 2026.
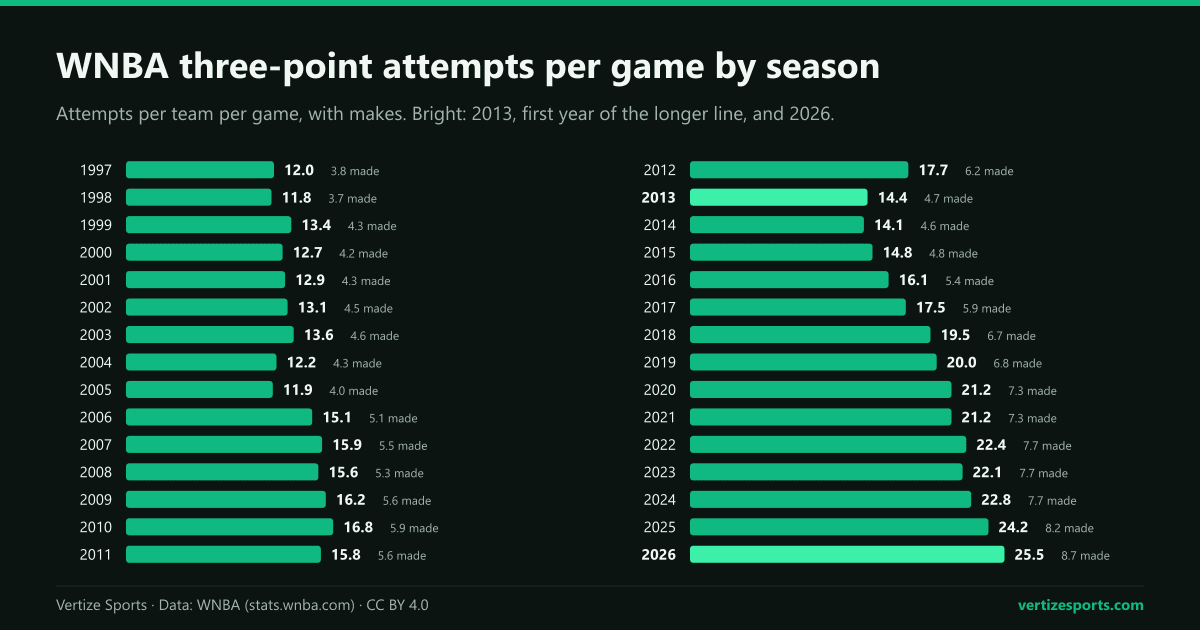
The one sharp break is 2013, the first season with the longer line, when attempts fell by 3.3 a game, more than twice any other one-season drop. Made threes fell from 6.2 a game to 4.7 and accuracy from 35.3 percent to 32.6 percent, and threes dropped from 26.6 percent of shots to 21.6 percent. Attempts did not pass the 2012 level again until 2018, at 19.5 a game.
Threes produced 15.9 percent of the league's points in 1998, the low, and a high of 30.1 percent in 2025. In 2026 the share slipped to 29.9 percent, because points from twos and free throws, taken together, grew faster.
WNBA pace and free throws by season
The league's logs do not count possessions, so pace here is an estimate with the standard formula, per team per game:
- Possessions = field-goal attempts, minus offensive rebounds, plus turnovers, plus 0.44 times free-throw attempts.
- Offensive rebounds are subtracted because they extend a possession instead of starting a new one.
- The 0.44 turns free throws into possessions: a two-shot foul ends a possession with two attempts, while an and-one or a technical free throw ends none.
Turnovers are missing from the league's logs for 1997, 2000 and 2003, so those seasons have no pace figure. Of the other 27, the slowest was 2001, at 71.1 possessions a game, and the fastest was 2026, at 83.1. Efficiency rose from 92.0 points per 100 possessions in 1998 to 104.8 in 2026; the previous high was 101.5 in 2018.
Free-throw attempts peaked at 21.6 a game in 2008 and bottomed out at 17.3 in 2019 and 2021; in 2026 they rose to 20.8, the most since 2016. Accuracy at the line went from 71.3 percent in 1997 to a peak of 80.8 percent in 2021, and was 78.6 percent in 2026.
WNBA scoring average in 2026 against 2025
The 2026 average of 87.1 points was 5.4 more than 2025's 81.7, the third-biggest one-season rise after 2006 and 2016. Teams scored 100 points or more 109 times, against 34 in 2025 and a previous high of 36 in 2023. All 13 teams that played both seasons scored more per game: the Indiana Fever rose the most, from 84.9 to 96.0, followed by the Chicago Sky, from 75.8 to 86.8, while the Seattle Storm barely moved, from 82.1 to 82.2.
The two expansion teams, the Toronto Tempo and the Portland Fire, explain little of the rise. The 245 games between the 13 returning teams averaged 86.2 points per team, 4.5 more than in 2025, so the newcomers add 0.8 of a point to the league average. The 85 games involving Toronto or Portland averaged 89.4 points, mostly because opponents scored 94.4 points a game against Toronto and 91.0 against Portland; the Tempo scored 85.7 and the Fire 86.2. Their records are ranked in our look at every WNBA expansion team's first season.
Of the 5.4 extra points per team, 2.0 came from free throws, 1.9 from two-pointers and 1.5 from three-pointers. Teams made 51.8 percent of their twos, the first season above 50 percent, up from 49.6 percent in 2025. Pace rose by 2.2 possessions, to 83.1, and points per 100 possessions reached 104.8; both are records.
The Indiana Fever averaged 96.0 points, the most by any WNBA team in a season, passing the 93.9 of the 2010 Phoenix Mercury. Four teams averaged 90 or more in 2026, Indiana, the Las Vegas Aces (91.5), the Atlanta Dream (91.3) and the Minnesota Lynx (90.8), as many as in the previous 29 seasons combined.
Every 2026 final score is on the 2026 WNBA schedule, and the WNBA season simulator shows the final standings with every game locked. The postseason is on the 2026 WNBA playoff bracket, and our guide to the WNBA playoff format explains how the eight teams were seeded.
WNBA scoring average: frequently asked questions
What is the average points per game in the WNBA? In the 2026 regular season, 87.1 points per team, or 174.1 for both teams combined, the highest in league history. In 2025 it was 81.7.
What was the highest-scoring WNBA season? 2026, at 87.1 points per team per game. The previous high was 83.1 in 2020, the 22-game season played entirely in Bradenton, Florida. The lowest was 2001, at 65.7.
How many three-pointers do WNBA teams shoot per game? In 2026 teams attempted 25.5 threes and made 8.7 per game, both records. Threes were 37.2 percent of all shots, against 19.6 percent in 1997.
When did the WNBA switch to a 24-second shot clock? In 2006, the same season games changed from two 20-minute halves to four 10-minute quarters. Scoring rose 7.9 points per team that year, the largest one-season increase in league history.
Which WNBA team scored the most points per game in a season? The 2026 Indiana Fever, at 96.0. The previous record was 93.9, by the 2010 Phoenix Mercury.
How this was built: every WNBA regular-season game from 1997 to September 24, 2026, from the league's team game logs on stats.wnba.com. Points per game include overtime. Pace is possessions per team per game, estimated with the formula above; it also includes overtime, because the logs record minutes reliably only from 2005, and taking overtime out would lower it by 0.2 to 1.4 possessions a season from 2005 on. Two games are missing from the logs, one in 2007 and one in 2009, and a 2018 game that was forfeited, not played, is left out. Twelve team box scores from 1997 to 2000 whose shooting lines do not add up to the final score are left out of the shooting, free-throw and pace figures. Every team's points per game from 1998 to 2026 matches the league's official standings, except the four teams in the two missing games. Rule changes are dated with Wikipedia's summary; current rules are from the 2026 WNBA rule book.