Home advantage gets talked about as if it were one thing. It is not. It is worth a different amount in every sport, it decides a different share of games in each, and in one of the six leagues below it is worth less than a tenth of a goal.
What was counted
Every completed regular-season game in six leagues, taken from the same feed that fills the scores on this site: 5,777 games in all. For each one, the home score minus the away score. Nothing is modelled or adjusted here, and nothing is weighted; it is a count.
Four of the six seasons are finished: the Premier League, the NBA and the NHL of 2025-26, and the NFL of 2025. The other two, the WNBA and MLB of 2026, are counted up to mid-September with the seasons still running. Exhibitions are left out, which means the All-Star games and the two NBA Cup rounds that do not count in the standings.
What a home game is worth
| League | Games | Home win | Draw | Away win | Home margin |
|---|---|---|---|---|---|
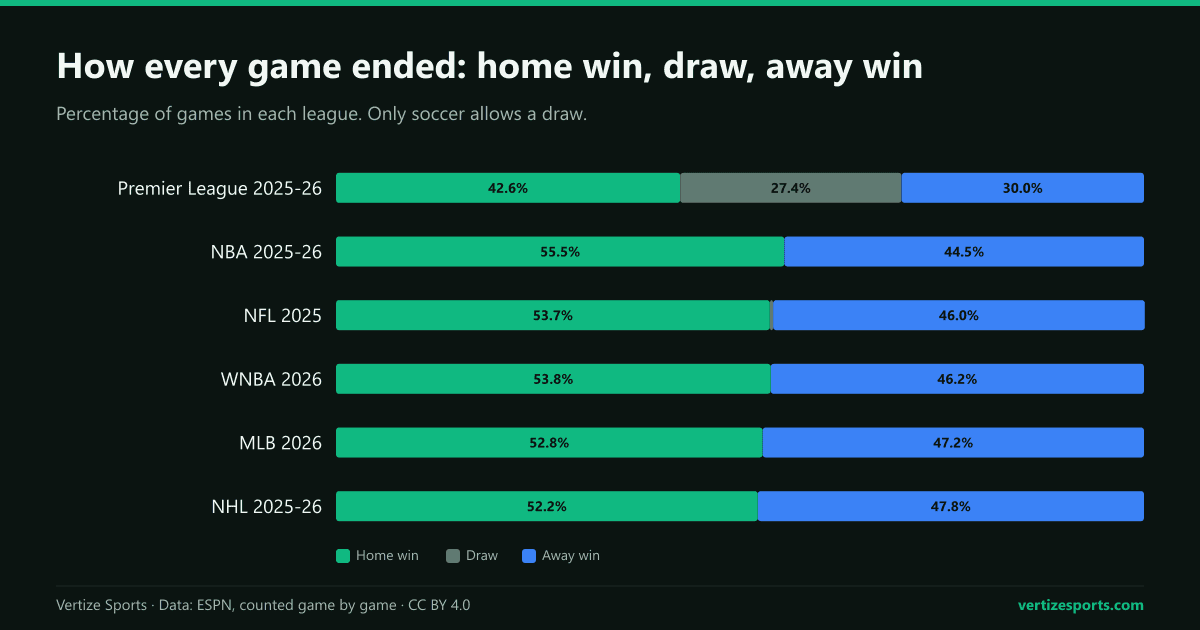
| Premier League 2025-26 | 380 | 42.6% | 27.4% | 30.0% | +0.30 goals |
| NBA 2025-26 | 1,228 | 55.5% | – | 44.5% | +1.75 points |
| WNBA 2026 | 301 | 53.8% | – | 46.2% | +1.80 points |
| NFL 2025 | 272 | 53.7% | – | 46.0% | +2.07 points |
| NHL 2025-26 | 1,312 | 52.2% | – | 47.8% | +0.13 goals |
| MLB 2026 | 2,284 | 52.8% | – | 47.2% | +0.07 runs |
Soccer has the most of it, hockey the least
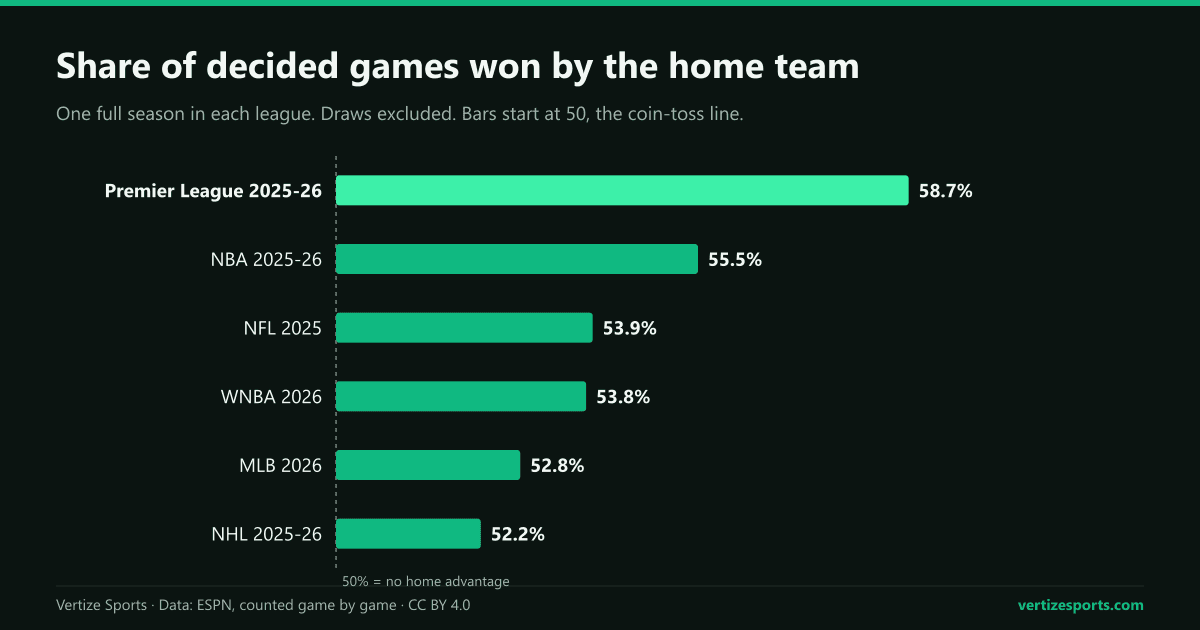
The win rates are not comparable as they stand, because one of the six sports allows draws and five do not. The fair comparison is the share of DECIDED games that the home side takes, and on that measure the order is clear:
- Premier League: 58.7 percent
- NBA: 55.5 percent
- NFL: 53.9 percent
- WNBA: 53.8 percent
- MLB: 52.8 percent
- NHL: 52.2 percent
The Premier League is the outlier. Home teams won 42.6 percent of matches, drew 27.4 and lost 30.0, scoring 1.53 goals a game against 1.22. Put another way, when a Premier League match produced a winner, the home side was it 58.7 percent of the time. At the other end, an NHL home team wins 52.2 percent of the games that get decided, which is close enough to a coin toss that a single result tells you nothing.
A point is not a point
The raw edges look nothing alike. An NFL home team outscores the visitor by 2.07 points a game, an NBA home team by 1.75, an NHL home team by 0.13 goals and an MLB home team by 0.07 runs. But those numbers are not measured on the same ruler, and the size of the edge is only half the story.
The other half is how much a game swings from one to the next. NFL margins scatter about 14.2 points around their average and NBA margins about 16.4, so an edge of two points, which sounds decisive, is a small nudge inside a wide distribution. It turns into a home win rate of 53.7 percent, not something in the seventies. Seven hundredths of a run in baseball is a nudge so small it should be invisible, and yet the home team still wins 52.8 percent of the time. That one is worth a paragraph of its own.
The exception: baseball wins more than its runs say
Feed the measured run differential into the MLB simulator and it produces home wins about 50.3 percent of the time. Real baseball, over the 2,284 games counted here, gives 52.8 percent. The NBA and NHL models land within a point of what their leagues actually do; baseball is the one that misses, and the reason is in the rules rather than in the numbers.
A home team that leads after the top of the ninth does not bat again. Its runs are cut off exactly in the games it is winning, which holds its run differential down while its win column keeps filling. Run differential understates the home team in baseball, and any model built on run differential alone inherits that. It is the clearest case on the site of a number being right and still not telling the whole story.
What the simulators do with it
This is where the number stops being trivia. Every simulator on the site starts each game by giving the home team this edge, measured this way and updated when a season ends, and then adds the randomness the sport actually shows.
- In soccer, goals are drawn from a Poisson distribution, the one goals really follow, with the home side on 1.50 expected goals and the away side on 1.25 before any difference in quality is applied. Those are the Premier League averages; last season came in at 1.53 and 1.22.
- In basketball, football, hockey and baseball, what gets drawn is the margin and the total, not each score on its own, because that is what has a stable shape: a team wins by six, not by a number of rare events.
- The home edge is built in: 1.7 points in the NBA, 2.1 in the NFL, about two points in the WNBA, a tenth of a goal in the NHL and a fraction of a run in MLB.
- The spread is measured too, and it is what is left once the difference between the two teams is taken out: about 11 points in an NFL game and 14 in an NBA one. That is the part no rating can predict.
For a worked example of the other half of the model, the team ratings, see our projected wins for every NBA team in 2026-27, which runs the full schedule through the same machinery.
See it for yourself
The quickest way to feel the difference between the sports is to run the same experiment twice in two of them.
- Open a simulator and press Simulate season. Every game gets a scoreline drawn from the model, home edge included.
- Run it again. The NBA table comes out much like the first one and the NHL and MLB tables do not, because a standard step up in quality is worth 0.44 of a game's randomness in basketball against 0.20 in hockey and 0.17 in baseball. The better team wins more often in the NBA, so the season sorts itself out.
- Fill in a night or a matchday by hand instead, and watch the table reorder under your picks.
- Games that have already been played are locked with their real scores, so from the middle of a season you are finishing it rather than inventing it.
These are single seasons, and home advantage drifts from one to the next. The numbers here are the ones the seasons named above produced, counted game by game, and they get counted again when a season ends.