The Cup is back for its fourth edition on Friday, October 30, ten days after the opening night of the 2026-27 season. Each team plays four group games that also count in the regular-season standings, and eight teams go on to the knockout rounds in December. The final moves this year from Las Vegas to Hinkle Fieldhouse in Indianapolis, on December 11.
We played the whole thing forward 100,000 times with the game model behind the Vertize NBA simulator: every group game on the real schedule, the tiebreakers as the league applies them, and each round of the bracket. Here is what comes out, group by group.
How the 2026 NBA Cup works
- The 30 teams were drawn at random into six groups of five, three per conference, based on their 2025-26 records.
- Each team plays the other four in its group once, two at home and two away, on Cup nights between October 30 and November 27. Every group game counts in the standings.
- The six group winners and one wild card per conference, the best record among the teams that did not win their group, advance: eight teams in all.
- Ties are broken by head-to-head result, then point differential in group play, then total points, then the 2025-26 record. Games that go to overtime count as zero in the point-differential tiebreaker.
- The quarterfinals (December 4-5) and, new this year, the semifinals (December 8-9) are played at the higher seed's arena. The final is on Friday, December 11 in Indianapolis, and it is the only Cup game that does not count in the standings.
The six groups and every team's odds
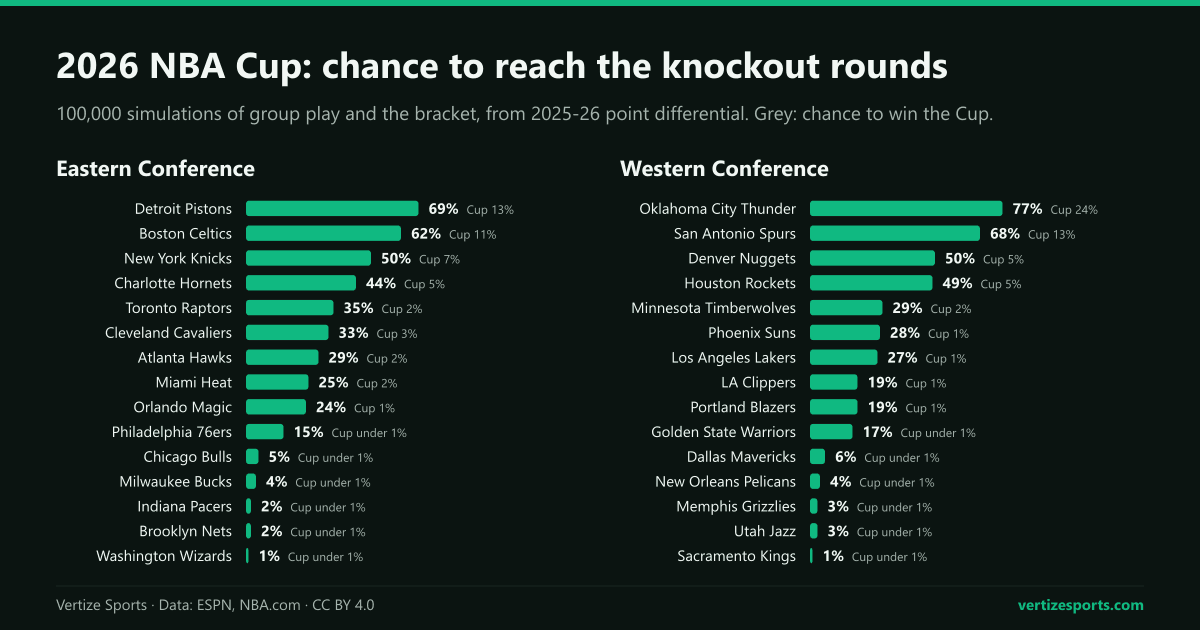
The tables list each group from favorite to long shot, with the chance of winning the group, of reaching the knockout rounds either way and of lifting the Cup. The team ratings are each side's point differential per game last season, so a club that changed a lot over the summer is where its 2025-26 numbers put it.
| Team | Group | 2025-26 | Wins group | Knockouts | Wins Cup |
|---|---|---|---|---|---|
| Detroit Pistons | Group A | 60-22 | 55% | 69% | 13% |
| Toronto Raptors | Group A | 46-36 | 23% | 35% | 2% |
| Orlando Magic | Group A | 45-37 | 17% | 24% | 1% |
| Milwaukee Bucks | Group A | 32-50 | 3% | 4% | under 1% |
| Brooklyn Nets | Group A | 20-62 | 1% | 2% | under 1% |
| New York Knicks | Group B | 53-29 | 41% | 50% | 7% |
| Cleveland Cavaliers | Group B | 52-30 | 26% | 33% | 3% |
| Miami Heat | Group B | 43-39 | 19% | 25% | 2% |
| Philadelphia 76ers | Group B | 45-37 | 13% | 15% | under 1% |
| Indiana Pacers | Group B | 19-63 | 2% | 2% | under 1% |
| Boston Celtics | Group C | 56-26 | 46% | 62% | 11% |
| Charlotte Hornets | Group C | 44-38 | 31% | 44% | 5% |
| Atlanta Hawks | Group C | 46-36 | 19% | 29% | 2% |
| Chicago Bulls | Group C | 31-51 | 3% | 5% | under 1% |
| Washington Wizards | Group C | 17-65 | 1% | 1% | under 1% |
| Team | Group | 2025-26 | Wins group | Knockouts | Wins Cup |
|---|---|---|---|---|---|
| Denver Nuggets | Group A | 54-28 | 38% | 50% | 5% |
| Houston Rockets | Group A | 52-30 | 36% | 49% | 5% |
| Phoenix Suns | Group A | 45-37 | 20% | 28% | 1% |
| Dallas Mavericks | Group A | 26-56 | 4% | 6% | under 1% |
| Utah Jazz | Group A | 22-60 | 2% | 3% | under 1% |
| Oklahoma City Thunder | Group B | 64-18 | 63% | 77% | 24% |
| Minnesota Timberwolves | Group B | 49-33 | 18% | 29% | 2% |
| LA Clippers | Group B | 42-40 | 13% | 19% | 1% |
| New Orleans Pelicans | Group B | 26-56 | 3% | 4% | under 1% |
| Memphis Grizzlies | Group B | 25-57 | 2% | 3% | under 1% |
| San Antonio Spurs | Group C | 62-20 | 55% | 68% | 13% |
| Los Angeles Lakers | Group C | 53-29 | 18% | 27% | 1% |
| Portland Trail Blazers | Group C | 42-40 | 14% | 19% | 1% |
| Golden State Warriors | Group C | 37-45 | 12% | 17% | under 1% |
| Sacramento Kings | Group C | 22-60 | 1% | 1% | under 1% |
Why 3-1 is often not enough in the NBA Cup
Only one of the twelve teams that finish behind a group winner in each conference goes through, and in our simulations that wild card has a 3-1 record 97% of the time. On an average draw, 4.6 teams go 3-1 without winning their group, across both conferences, and only two of them advance.
That makes point differential the stat that matters in November. With several 3-1 teams tied on record and no head-to-head result between them, the wild card goes to the one that won by more, so a team up by 20 on a Cup night has a reason to keep scoring. Winning the group takes a perfect record about half the time: group winners go 4-0 in 51% of our simulations. And in a three-way tie at 3-1, where each team beat one of the others, it comes down to point differential again.
The favorites: Oklahoma City, Detroit, San Antonio and Boston
The Thunder had the best point differential in the league last season, +11.1 a game, and landed in West Group B with Minnesota, the Clippers, New Orleans and Memphis. They win the group 63% of the time, reach the knockouts 77% and the final 37%. Nobody else is as secure: Detroit wins East Group A 55% of the time and San Antonio West Group C 55%, and Boston is the favorite in East Group C at 46%.
The defending champions are further back. The Knicks beat San Antonio 124-113 in last year's Cup final and then beat them again in the NBA Finals, the first time the two Cup finalists met for the title. But their 2025-26 point differential of +6.3 was the fifth best in the league, and East Group B is the only group with four teams that won at least half their games last season: New York wins it 41% of the time, Cleveland 26%, Miami 19% and Philadelphia 13%. The model gives the Knicks 7% to repeat.
The most open group is West Group A, where Denver (38%) and Houston (36%) both finished last season at +5.2 points a game and Phoenix wins it 20% of the time. And one team the tables flag is Charlotte: a 44-38 side last year with a +4.8 differential, better than its record, which reaches the knockouts 44% of the time from Boston's group.
Across the bracket the two conferences are close to level: the East wins the Cup 46% of the time and the West 54%. The top of the draw belongs to the West, but its three favorites can also meet each other: seeds one to four play within each conference until the final.
The 2026 NBA Cup schedule
- Group play: Friday nights from October 30 to November 27, plus Tuesday, November 24 and Wednesday, November 25. The full nights are on the November NBA schedule.
- Quarterfinals: December 4-5, at the arenas of the higher seeds: the two best group winners in each conference host the third group winner and the wild card.
- Semifinals: December 8-9, one per conference, again at the higher seed's arena.
- Final: Friday, December 11, at Hinkle Fieldhouse in Indianapolis.
Past NBA Cup winners
| Season | Champion | Final | Runner-up | MVP |
|---|---|---|---|---|
| 2023-24 | Los Angeles Lakers | 123-109 | Indiana Pacers | LeBron James |
| 2024-25 | Milwaukee Bucks | 97-81 | Oklahoma City Thunder | Giannis Antetokounmpo |
| 2025-26 | New York Knicks | 124-113 | San Antonio Spurs | Jalen Brunson |
Three editions, three different champions, and none of them the team with the best record the season before. It is a reminder of how short the path is: four group games and three knockout games decide it, where the regular season takes 82. For how the same teams project over a full season, see our 2026-27 NBA predictor.
NBA Cup 2026: frequently asked questions
When does the 2026 NBA Cup start? On Friday, October 30, with the first night of group play. The group stage ends on November 27 and the knockout rounds start on December 4.
Where is the 2026 NBA Cup final? At Hinkle Fieldhouse, Butler University's arena in Indianapolis, on Friday, December 11. The first three finals were in Las Vegas.
How many teams make the NBA Cup knockout rounds? Eight: the six group winners and one wild card from each conference, the non-winner with the best group record.
Who is favored to win the 2026 NBA Cup? The Oklahoma City Thunder, in 24% of our simulations, followed by Detroit (13%), San Antonio (13%) and Boston (11%).
Do NBA Cup games count in the standings? Yes, all of them except the final. Group games and the knockout games up to the semifinals count as regular-season games; the two finalists play 83 games instead of 82.
How this was built: the groups and the 60 group games come from NBA.com and ESPN's 2026-27 schedule. Every game is simulated with the model from the Vertize NBA simulator: each team is rated on its 2025-26 point differential per game, the home side gets 1.72 points, and the result carries the randomness of real NBA games (a spread of 13.9 points). A game level after regulation goes to overtime, which counts as zero in the point-differential tiebreaker. Group standings use the league's tiebreakers in order, the bracket seeds group winners one to three and the wild card fourth, and the whole competition is played 100,000 times. Injuries, trades and signings since last season are not in the model.