We counted every 3-point attempt and make in all 35,546 regular-season games in NBA.com's team game logs from 1996-97 to 2025-26, per team per game. The figures match our NBA points per game by season, which covers scoring and pace; this piece is about the shot and who takes it.
NBA three-point attempts per game by year since 1996-97
Attempts stayed between 12.7 and 18.4 a game from 1997-98 to 2011-12, then rose in 11 straight seasons, from 2011-12 to 2021-22. Games of 40 attempts or more went from rare to routine: 1.7 percent of team games in 2015-16, 37.9 percent in 2024-25 and 35.6 percent in 2025-26.
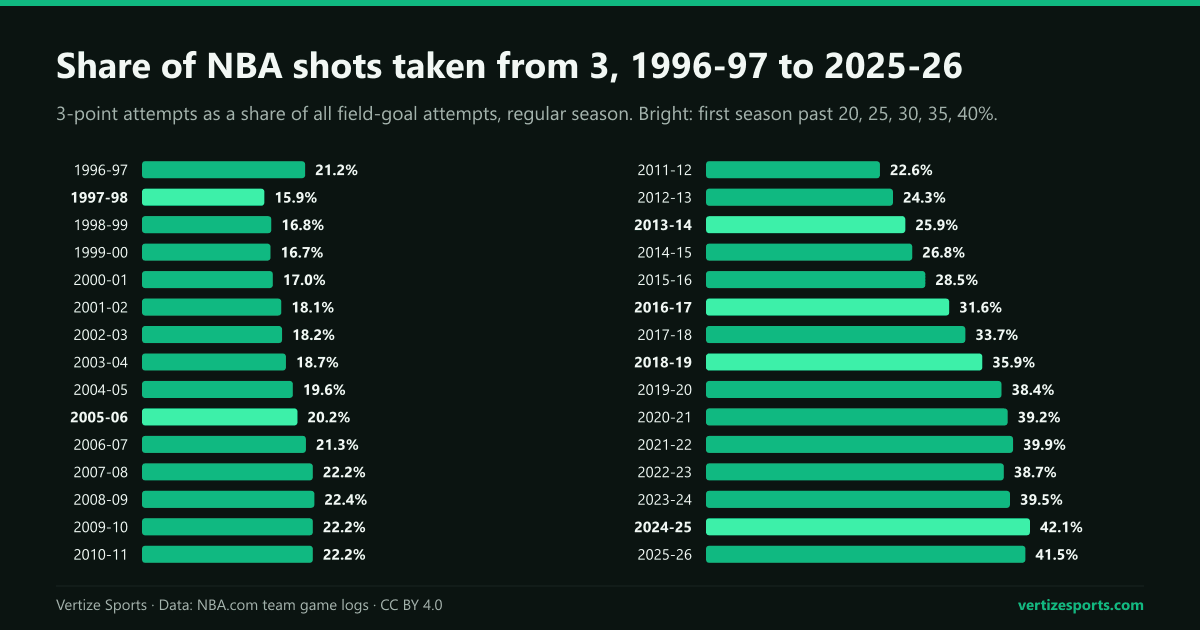
The share of shots from 3 is the cleaner measure, because it does not depend on how fast teams play. It bottomed out at 15.9 percent in 1997-98, and no mark in the table below has been given back once crossed.
| Share of shots from 3 | First season | 3PA per game | 3P% |
|---|---|---|---|
| 20% | 2005-06 | 16.0 | 35.8% |
| 25% | 2013-14 | 21.5 | 36.0% |
| 30% | 2016-17 | 27.0 | 35.8% |
| 35% | 2018-19 | 32.0 | 35.5% |
| 40% | 2024-25 | 37.6 | 36.0% |
- Twos still outnumber threes: teams took 52.1 two-point attempts a game in 2025-26, down from 67.0 in 1997-98, or 1.4 twos for every three, down from 5.3.
- Team games with more 3-point attempts than 2-point attempts happened three times in the 15 seasons from 1996-97 to 2010-11. They were 13.1 percent of team games in 2024-25 and 12.9 percent in 2025-26.
- Only four teams have taken more threes than twos over a full season: the Houston Rockets in 2017-18, 2018-19 and 2019-20, and the Boston Celtics in 2024-25.
- The highest single-team rate is those 2024-25 Celtics, at 48.2 attempts a game. The lowest since 1996-97 is the 1998-99 Philadelphia 76ers, at 7.4.
NBA 3-point percentage by year: more shots, same accuracy
League-wide 3-point percentage has stayed between 33.9 and 36.7 percent in every season since 1996-97; it was 36.0 percent in 2025-26. The gain is all volume.
What changed is the value of the remaining twos. In 1997-98 a 3-point attempt was worth 1.04 points and a 2-point attempt 0.94. By 2025-26 two-point accuracy had risen from 47.0 percent to 55.0 percent, the highest of the 30 seasons, and a two was worth 1.10 points per attempt against 1.08 for a three. Twos out-earned threes in 2021-22, 2022-23, 2024-25 and 2025-26 and in no season before, not counting free throws from shooting fouls.
Before 1996-97: the 3-point line arrives in 1979-80
The NBA adopted the 3-point line in June 1979, at first on a one-year trial, and Chris Ford of the Boston Celtics is credited with the first make, on October 12, 1979. Wikipedia's table of league averages puts 1979-80 at 2.8 attempts and 0.8 makes per team per game, and 1989-90 at 6.6; in Game 4 of the 1980 Finals neither team attempted one. Its attempt figures for 1999-2000, 2019-20 and 2024-25 match ours.
For three seasons from 1994-95, the league shortened the line from 23 feet 9 inches (22 feet in the corners) to a uniform 22 feet, and moved it back for 1997-98. Our data catches the last of those seasons: 16.8 attempts a game and 21.2 percent of shots in 1996-97, then 12.7 and 15.9 percent with the longer line. Attempts did not return to the 1996-97 level until 2006-07.
The gap between the most and least three-happy NBA teams
Teams have converged. In 2002-03 the Boston Celtics took 26.3 threes a game and the Utah Jazz 7.8, a ratio of 3.4 to 1, the widest of the period. In 2025-26 the Golden State Warriors led with 44.1 and the Sacramento Kings took the fewest, 30.2, a ratio of 1.5; the narrowest was 1.4 in 2023-24. Sacramento's 30.2, the lowest volume of 2025-26, would have led the league in every season through 2013-14.
Do more threes win NBA games?
Not by themselves. In the 32,400 games since 1996-97 in which one team made more threes than the other, that team won 63.7 percent of the time. The team that attempted more won 50.0 percent, and in 14 of the 30 seasons it won less than half, including every season from 1996-97 to 2003-04; the range by season is 45.5 to 54.7 percent.
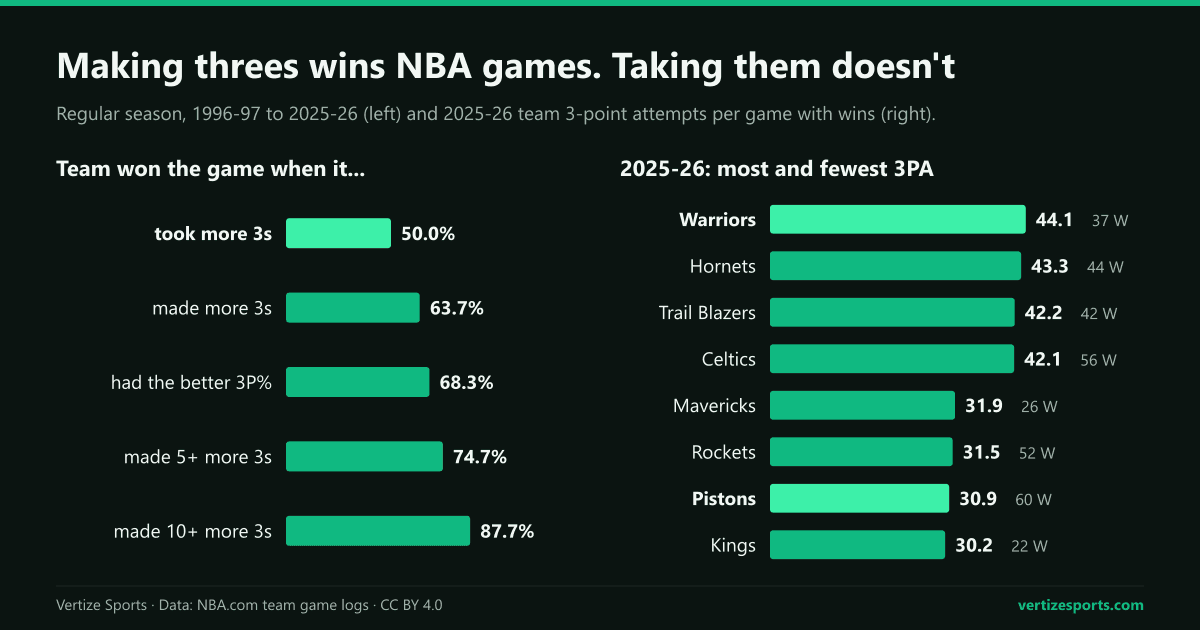
- Accuracy decides more than volume: the team with the better 3-point percentage won 68.3 percent of games, those with five or more extra makes 74.7 percent and those with 10 or more 87.7 percent.
- The edge from making more threes has grown, from 60.3 percent of games in the first 10 seasons, 1996-97 to 2005-06, to 66.4 percent in the last 10, 2016-17 to 2025-26.
- Over full seasons, the correlation between a team's attempts and its win percentage averaged 0.21, against 0.52 for 3-point percentage, and percentage tracked winning more closely in 29 of the 30 seasons. In 2025-26 it was 0.04 for attempts and 0.45 for percentage.
Champions show the same pattern. Their median rank in regular-season attempts is 11th, 13 of the 30 ranked in the top 10, and only one led the league: the 2023-24 Boston Celtics. The team with the best record led in attempts five times: the 2004-05 Phoenix Suns, 2015-16 Golden State Warriors, 2017-18 Houston Rockets, 2020-21 Utah Jazz and 2023-24 Celtics. How often the best record wins the title is in our study of the NBA's best regular-season teams.
NBA three-point leaders and laggards in 2025-26
The 2025-26 regular season ran from October 21, 2025 to April 12, 2026. The order of attempts says little about the standings: the Detroit Pistons, best in the Eastern Conference at 60-22, ranked 29th, and the Oklahoma City Thunder, best in the league at 64-18, ranked 13th.
- Most attempts: the Golden State Warriors, 44.1 a game and 49.7 percent of their shots, with a 37-45 record. The Charlotte Hornets were second at 43.3 and made the most, 16.4.
- Fewest attempts: the Sacramento Kings, 30.2, with 22 wins. The champion New York Knicks ranked 12th, and the Denver Nuggets shot best, 39.6 percent.
| Team | 3PA | 3PM | 3P% | Record |
|---|---|---|---|---|
| Warriors | 44.1 | 15.7 | 35.6% | 37-45 |
| Hornets | 43.3 | 16.4 | 37.8% | 44-38 |
| Trail Blazers | 42.2 | 14.5 | 34.3% | 42-40 |
| Celtics | 42.1 | 15.5 | 36.7% | 56-26 |
| Suns | 40.8 | 14.8 | 36.1% | 45-37 |
| Bulls | 40.1 | 14.3 | 35.6% | 31-51 |
| Cavaliers | 39.8 | 14.3 | 36.0% | 52-30 |
| Grizzlies | 39.5 | 13.9 | 35.3% | 25-57 |
| Hawks | 39.5 | 14.6 | 37.1% | 46-36 |
| Bucks | 39.1 | 15.1 | 38.7% | 32-50 |
| Nets | 38.4 | 13.1 | 34.0% | 20-62 |
| Knicks | 38.2 | 14.2 | 37.3% | 53-29 |
| Thunder | 37.9 | 13.8 | 36.5% | 64-18 |
| Spurs | 37.9 | 13.6 | 35.9% | 62-20 |
| Heat | 37.9 | 13.7 | 36.1% | 43-39 |
| Pacers | 37.6 | 13.4 | 35.6% | 19-63 |
| Timberwolves | 37.2 | 13.8 | 37.0% | 49-33 |
| Jazz | 36.7 | 12.6 | 34.5% | 22-60 |
| Wizards | 36.4 | 13.0 | 35.9% | 17-65 |
| Nuggets | 35.8 | 14.2 | 39.6% | 54-28 |
| 76ers | 35.3 | 12.3 | 34.9% | 45-37 |
| Magic | 34.1 | 11.7 | 34.3% | 45-37 |
| Clippers | 33.8 | 12.4 | 36.8% | 42-40 |
| Lakers | 32.9 | 11.8 | 35.9% | 53-29 |
| Pelicans | 32.1 | 11.1 | 34.7% | 26-56 |
| Raptors | 32.1 | 11.4 | 35.4% | 46-36 |
| Mavericks | 31.9 | 11.0 | 34.4% | 26-56 |
| Rockets | 31.5 | 11.5 | 36.4% | 52-30 |
| Pistons | 30.9 | 11.0 | 35.6% | 60-22 |
| Kings | 30.2 | 10.3 | 34.0% | 22-60 |
The 2026-27 regular season opened on Tuesday, October 20. Every game is on the NBA schedule, and in the NBA season simulator you can pick results and play out the season.
NBA 3-point attempts by season: the full table
| Season | 3PA | Share of shots | Most 3PA | Fewest 3PA |
|---|---|---|---|---|
| 2025-26 | 37.0 | 41.5% | Warriors 44.1 | Kings 30.2 |
| 2024-25 | 37.6 | 42.1% | Celtics 48.2 | Nuggets 31.9 |
| 2023-24 | 35.1 | 39.5% | Celtics 42.5 | Nuggets 31.2 |
| 2022-23 | 34.2 | 38.7% | Warriors 43.2 | Bulls 28.9 |
| 2021-22 | 35.2 | 39.9% | Timberwolves 41.3 | Bulls 28.8 |
| 2020-21 | 34.6 | 39.2% | Jazz 43.0 | Spurs 28.4 |
| 2019-20 | 34.1 | 38.4% | Rockets 45.3 | Pacers 28.0 |
| 2018-19 | 32.0 | 35.9% | Rockets 45.4 | Spurs 25.3 |
| 2017-18 | 29.0 | 33.7% | Rockets 42.3 | Timberwolves 22.5 |
| 2016-17 | 27.0 | 31.6% | Rockets 40.3 | Timberwolves 21.0 |
| 2015-16 | 24.1 | 28.5% | Warriors 31.6 | Bucks 15.6 |
| 2014-15 | 22.4 | 26.8% | Rockets 32.7 | Timberwolves 14.9 |
| 2013-14 | 21.5 | 25.9% | Rockets 26.6 | Grizzlies 14.0 |
| 2012-13 | 20.0 | 24.3% | Knicks 28.9 | Grizzlies 13.5 |
| 2011-12 | 18.4 | 22.6% | Magic 27.0 | Hornets 11.8 |
| 2010-11 | 18.0 | 22.2% | Magic 25.6 | Grizzlies 11.3 |
| 2009-10 | 18.1 | 22.2% | Magic 27.3 | Grizzlies 12.4 |
| 2008-09 | 18.1 | 22.4% | Knicks 27.9 | Thunder 11.6 |
| 2007-08 | 18.1 | 22.2% | Warriors 26.6 | SuperSonics 11.5 |
| 2006-07 | 16.9 | 21.3% | Warriors 24.0 | 76ers 10.0 |
| 2005-06 | 16.0 | 20.2% | Suns 25.6 | Magic 9.7 |
| 2004-05 | 15.8 | 19.6% | Suns 24.7 | Clippers 8.2 |
| 2003-04 | 14.9 | 18.7% | SuperSonics 23.6 | Jazz 9.6 |
| 2002-03 | 14.7 | 18.2% | Celtics 26.3 | Jazz 7.8 |
| 2001-02 | 14.7 | 18.1% | Celtics 23.7 | 76ers 8.7 |
| 2000-01 | 13.7 | 17.0% | Celtics 19.9 | Cavaliers 8.0 |
| 1999-00 | 13.7 | 16.7% | Kings 20.2 | 76ers 7.8 |
| 1998-99 | 13.2 | 16.8% | Kings 18.9 | 76ers 7.4 |
| 1997-98 | 12.7 | 15.9% | Rockets 20.4 | Jazz 8.2 |
| 1996-97 | 16.8 | 21.2% | Heat 22.7 | Jazz 11.0 |
NBA three-point attempts: frequently asked questions
How many 3-point attempts per game do NBA teams take? 37.0 per team in the 2025-26 regular season, after a record 37.6 in 2024-25. That is 41.5 percent of all field-goal attempts.
When did the NBA add the 3-point line? For the 1979-80 season. Teams took 2.8 threes a game that season, according to Wikipedia's table of league averages.
When was the NBA 3-point line shorter? From 1994-95 to 1996-97 it was a uniform 22 feet. It returned to 23 feet 9 inches, 22 in the corners, in 1997-98, and attempts fell from 16.8 a game to 12.7.
Do teams that shoot more 3s win more? Not on volume alone. Since 1996-97 the team that took more threes won 50.0 percent of games; the team that made more won 63.7 percent.
What is the most 3-pointers made by an NBA team in a game? 29 is the most in any regular-season game since 1996-97, reached four times: by the Milwaukee Bucks in 2020-21, the Boston Celtics in 2024-25 and 2025-26 and the Memphis Grizzlies, who lost that game to the Cleveland Cavaliers on April 6, 2026. The most attempts is 70, by the Houston Rockets in a January 2019 loss.
How this was built: every regular-season game from 1996-97 to 2025-26 in NBA.com's team game logs (the data behind its team box scores), 35,546 games; playoffs, the play-in and the NBA Cup final are excluded. A 2013 Celtics-Pacers game that was cancelled and never played is left out, and so are the shooting lines of one 1996-97 game, Denver at Cleveland, that do not add up to its score. Win rates leave out games tied in the stat compared (3,145 tied on 3-pointers made). Correlations are Pearson coefficients across each season's teams. History before 1996-97 comes from Wikipedia's article on the 3-point field goal.