We added up all 35,546 regular-season games in NBA.com's team game logs from 1996-97 to 2025-26 and divided points, shots and free throws by team games. Points per game here means per team, the way the league reports it. The logs begin in 1996-97, so earlier seasons appear only where NBA.com itself gives a figure.
NBA scoring by year: points per game since 1996-97
Across the 30 seasons, teams averaged 102.4 points a game. Every season from 1996-97 to 2008-09 stayed under 100, as did the three from 2010-11 to 2012-13. Every season since 2018-19 has been above 110, and the five highest-scoring seasons are 2025-26 at 115.6, 2022-23 at 114.7, 2023-24 at 114.2, 2024-25 at 113.8 and 2020-21 at 112.1.
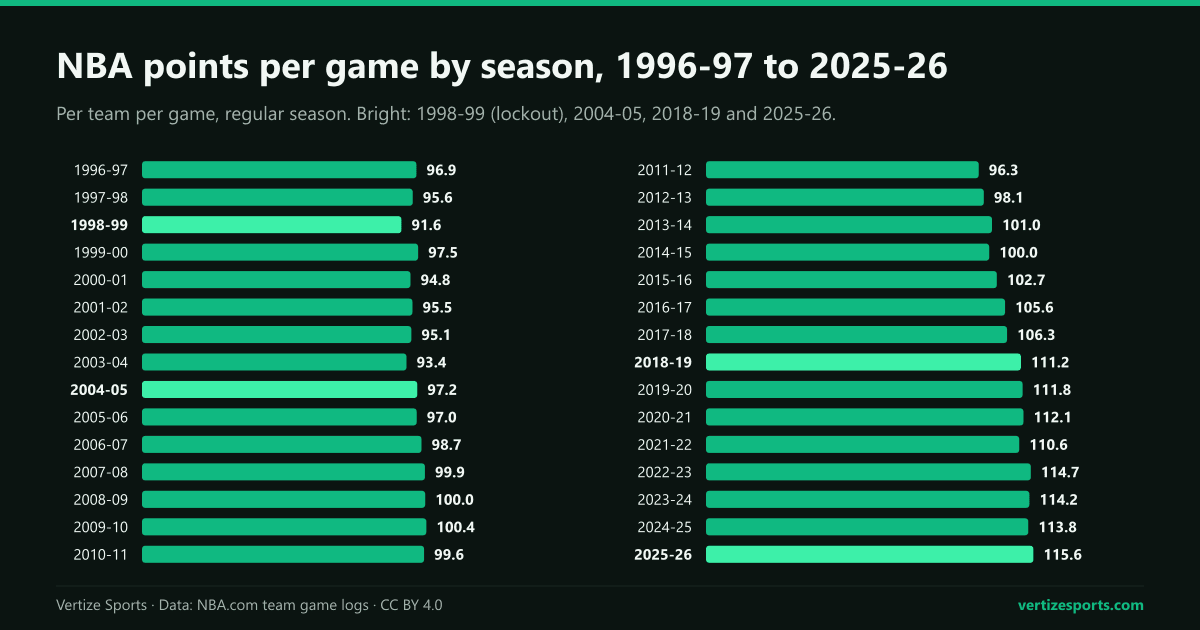
The share of team games with 120 points or more shows the change best: 0.8 percent in 1998-99 and 37.0 percent in 2025-26.
The highest scoring NBA season and the 1998-99 lockout low
The 1998-99 season is the floor. A lockout cost the first three months, play began in February 1999 and the schedule was cut from 82 games to 50. Teams scored 91.6 points a game, made 43.7 percent of their shots and played at the slowest pace of the 30 seasons, 91.6 possessions per 48 minutes. The Chicago Bulls averaged 81.9, the lowest for any team in the period.
- Lowest: 1998-99 at 91.6, 2003-04 at 93.4 and 2000-01 at 94.8.
- Highest: 2025-26 at 115.6, 2022-23 at 114.7 and 2023-24 at 114.2.
- Best team: the 2023-24 Indiana Pacers at 123.3, ahead of the 2025-26 Denver Nuggets at 122.1.
For the seasons before 1996-97, NBA.com gave one useful marker in October 2025: the 117.7 points per team the league scored in the first 10 days of 2025-26 would have been the third-highest mark in NBA history and the highest since 1961-62. The full season settled at 115.6.
NBA rule changes that moved scoring
Four rule changes since 1996-97 line up with clear moves in the numbers. The table compares the season before each with the first season under it.
| Season | Change | Points before | Points after |
|---|---|---|---|
| 1997-98 | 3-point line moved back after three shorter seasons | 96.9 | 95.6 |
| 2004-05 | Hand-checking outlawed | 93.4 | 97.2 |
| 2018-19 | Shot clock resets to 14 after an offensive rebound | 106.3 | 111.2 |
| 2021-22 | Offensive fouls for non-basketball moves | 112.1 | 110.6 |
- 1997-98: NBA.com counts three seasons with a shorter 3-point line, 1994-95 through 1996-97. When it moved back, 3-point attempts fell from 16.8 a game to 12.7, the fewest of the 30 seasons, and did not return to the 1996-97 level until 2006-07.
- 2004-05: hand-checking, a defender's hands on the ball handler, was outlawed in 2004. Scoring rose from 93.4 to 97.2. By our estimate about 2.8 of the 3.8 extra points came from scoring more per possession and 1.0 from extra possessions; free-throw attempts went from 24.2 to 26.1 a game, and reached 26.3 in 2005-06, the most of the period.
- 2018-19: the shot clock began resetting to 14 seconds instead of 24 after an offensive rebound. Pace jumped from 99.6 to 102.4 possessions per 48 minutes, and about 3.1 of the 4.9-point rise came from extra possessions.
- 2021-22: officials began calling offensive fouls on overt, abrupt or abnormal non-basketball moves, moves offensive players used to draw fouls. Scoring dipped from 112.1 to 110.6, and free-throw attempts stayed near the 2020-21 level, 21.8 to 21.9, after 23.1 in 2019-20.
New York Knicks coach Tom Thibodeau told NBA.com in January 2022 that most rule changes had favored the offense and that the 2021-22 interpretation was the first change to favor the defense instead. It did not last long in the numbers: in 2022-23 scoring rose 4.1 points, to 114.7, and 1.5 of that came from free throws.
NBA 3-point attempts per game by season
In 2010-11 teams took 18.0 3-pointers a game, 22.2 percent of their shots, and threes produced 19.5 percent of their points. By 2018-19 the figures were 32.0 attempts, 35.9 percent of shots and 30.7 percent of points. Attempts rose in 11 straight seasons, from 2011-12 to 2021-22.
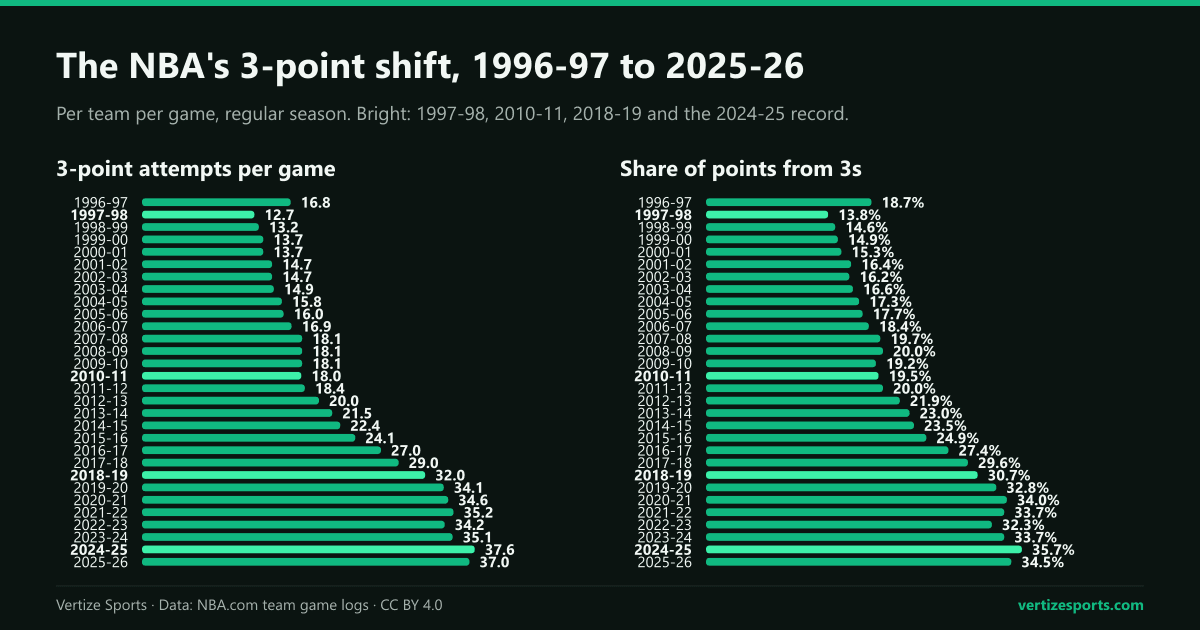
The record season is 2024-25: 37.6 attempts, 13.5 makes and 35.7 percent of points from 3s. Teams made about three times as many threes as in 1997-98, when they made 4.4. The accuracy barely moved: league-wide 3-point percentage has stayed between 33.9 and 36.7 percent in every season since 1996-97, so the gain came from volume.
The shift shows clearly in 2016-17, when scoring rose from 102.7 to 105.6 and threes added 3.4 points per team while points from two-pointers fell. Free throws went the other way: they made up 20.3 percent of points in 1997-98 and 15.9 percent in 2025-26.
Why is NBA scoring up: pace and efficiency
Points per game is possessions times points per possession. NBA.com's logs do not count possessions, so we estimate them with the standard formula: field-goal attempts, minus offensive rebounds, plus turnovers, plus 0.44 times free-throw attempts. Both parts have risen.
- Pace: from 91.6 possessions per 48 minutes in 1998-99 to 102.0 in 2025-26. The fastest season was 2019-20, at 102.7.
- Efficiency: from 99.2 points per 100 possessions in 1998-99 to 112.7 in 2025-26, the highest of the 30 seasons.
- The 2018-19 jump was mostly pace: field-goal attempts went from 86.1 to 89.2 a game. The 2004-05 jump was mostly efficiency.
NBA.com counts possessions from play-by-play, so its own pace and efficiency figures differ slightly from these estimates.
NBA scoring 2025-26: the season in numbers
The 2025-26 regular season ran from October 21, 2025 to April 12, 2026. Teams scored 115.6 points a game, 1.8 more than in 2024-25. After two seasons of decline, free-throw attempts rose from 21.7 a game to 23.5, the most since 2022-23, and added 1.5 points per team; two-pointers added 1.0, while points from threes fell by 0.7. In the first 10 days of the season, NBA.com counted 45.7 fouls a game, up 23 percent from the year before.
- 3-pointers: 37.0 attempts and 13.3 makes per team per game, down from the 2024-25 records of 37.6 and 13.5; 41.5 percent of shots, after 42.1 percent; 36.0 percent accuracy.
- Share of points from 3s: 34.5 percent, down from 35.7 percent.
- Pace and efficiency: 102.0 possessions per 48 minutes, up from 101.4, and 112.7 points per 100 possessions, up from 111.6.
- Highest-scoring teams: the Denver Nuggets at 122.1 points a game, the Miami Heat at 120.9 and the San Antonio Spurs at 119.8. The Brooklyn Nets were the only team under 110.5, at 105.9.
- Most 3-point attempts: the Golden State Warriors, 44.1 a game, ahead of the Charlotte Hornets at 43.3. Denver also scored the most per possession, 119.4 points per 100.
The 2026-27 regular season opens on Tuesday, October 20, with the Boston Celtics at the Detroit Pistons, the Philadelphia 76ers at the New York Knicks and the San Antonio Spurs against the Oklahoma City Thunder. Every game is on the NBA schedule, and in the NBA season simulator you can pick results and play out the season. How rest and travel shape those games is in our study of NBA back-to-backs.
For comparison, MLB teams scored 4.48 runs per game in 2026, as our MLB runs per game by season analysis shows, and NHL games averaged 6.16 goals in 2025-26, a fifth straight season above six, in NHL goals per game by season.
NBA points per game by season: the full table
| Season | Points | 3PA | 3PM | 3P% | Points from 3s | FTA | Pace |
|---|---|---|---|---|---|---|---|
| 2025-26 | 115.6 | 37.0 | 13.3 | 36.0% | 34.5% | 23.5 | 102.0 |
| 2024-25 | 113.8 | 37.6 | 13.5 | 36.0% | 35.7% | 21.7 | 101.4 |
| 2023-24 | 114.2 | 35.1 | 12.8 | 36.6% | 33.7% | 21.7 | 100.9 |
| 2022-23 | 114.7 | 34.2 | 12.3 | 36.1% | 32.3% | 23.5 | 101.5 |
| 2021-22 | 110.6 | 35.2 | 12.4 | 35.4% | 33.7% | 21.9 | 100.6 |
| 2020-21 | 112.1 | 34.6 | 12.7 | 36.7% | 34.0% | 21.8 | 101.4 |
| 2019-20 | 111.8 | 34.1 | 12.2 | 35.8% | 32.8% | 23.1 | 102.7 |
| 2018-19 | 111.2 | 32.0 | 11.4 | 35.5% | 30.7% | 23.1 | 102.4 |
| 2017-18 | 106.3 | 29.0 | 10.5 | 36.2% | 29.6% | 21.7 | 99.6 |
| 2016-17 | 105.6 | 27.0 | 9.7 | 35.8% | 27.4% | 23.1 | 98.7 |
| 2015-16 | 102.7 | 24.1 | 8.5 | 35.4% | 24.9% | 23.4 | 98.1 |
| 2014-15 | 100.0 | 22.4 | 7.8 | 35.0% | 23.5% | 22.8 | 96.3 |
| 2013-14 | 101.0 | 21.5 | 7.7 | 36.0% | 23.0% | 23.6 | 96.3 |
| 2012-13 | 98.1 | 20.0 | 7.2 | 35.9% | 21.9% | 22.2 | 94.4 |
| 2011-12 | 96.3 | 18.4 | 6.4 | 34.9% | 20.0% | 22.5 | 93.8 |
| 2010-11 | 99.6 | 18.0 | 6.5 | 35.8% | 19.5% | 24.4 | 94.5 |
| 2009-10 | 100.4 | 18.1 | 6.4 | 35.5% | 19.2% | 24.5 | 95.1 |
| 2008-09 | 100.0 | 18.1 | 6.6 | 36.7% | 20.0% | 24.7 | 94.1 |
| 2007-08 | 99.9 | 18.1 | 6.6 | 36.2% | 19.7% | 24.9 | 94.8 |
| 2006-07 | 98.7 | 16.9 | 6.1 | 35.8% | 18.4% | 26.1 | 94.3 |
| 2005-06 | 97.0 | 16.0 | 5.7 | 35.8% | 17.7% | 26.3 | 93.0 |
| 2004-05 | 97.2 | 15.8 | 5.6 | 35.6% | 17.3% | 26.1 | 93.6 |
| 2003-04 | 93.4 | 14.9 | 5.2 | 34.7% | 16.6% | 24.2 | 92.6 |
| 2002-03 | 95.1 | 14.7 | 5.1 | 34.9% | 16.2% | 24.4 | 93.6 |
| 2001-02 | 95.5 | 14.7 | 5.2 | 35.4% | 16.4% | 23.8 | 93.3 |
| 2000-01 | 94.8 | 13.7 | 4.8 | 35.4% | 15.3% | 24.9 | 93.8 |
| 1999-00 | 97.5 | 13.7 | 4.8 | 35.3% | 14.9% | 25.3 | 95.7 |
| 1998-99 | 91.6 | 13.2 | 4.5 | 33.9% | 14.6% | 25.8 | 91.6 |
| 1997-98 | 95.6 | 12.7 | 4.4 | 34.6% | 13.8% | 26.3 | 93.0 |
| 1996-97 | 96.9 | 16.8 | 6.0 | 36.0% | 18.7% | 25.4 | 92.7 |
NBA points per game: frequently asked questions
What is the average points per game in the NBA? In the 2025-26 regular season, 115.6 per team, or about 231 for both teams together. Across the 30 seasons since 1996-97 it is 102.4 per team.
What was the highest scoring NBA season? Since 1996-97, 2025-26, at 115.6 points per team per game. NBA.com counts at least one higher-scoring season, 1961-62, before the period our data covers.
What was the lowest scoring NBA season since 1996-97? The 1998-99 lockout season, at 91.6 points per team per game, followed by 2003-04 at 93.4.
How many 3-pointers do NBA teams attempt per game? 37.0 per team in 2025-26, after a record 37.6 in 2024-25, up from 12.7 in 1997-98.
Why is NBA scoring up? Teams play faster, about 102.0 possessions per 48 minutes against 91.6 in 1998-99, and score more per possession, with far more 3-pointers. The 2004 ban on hand-checking and the 2018 shot-clock reset each came with a jump in scoring.
How this was built: every regular-season game from 1996-97 to 2025-26 in NBA.com's team game logs (the data behind its team box scores), 35,546 games; playoffs, the play-in and the NBA Cup final are excluded. Points per game include overtime and are per team. A 2013 Celtics-Pacers game that was cancelled and never played is left out. In one 1996-97 game, Denver at Cleveland, the shooting lines do not add up to the logged score, so it counts for points but not for shots, free throws or pace. Every team's points per game from 1996-97 to 2025-26 matches NBA.com's official standings except the two teams in that game. Possessions are estimated as field-goal attempts minus offensive rebounds plus turnovers plus 0.44 times free-throw attempts; pace is per 48 minutes. Rule changes are dated from NBA.com pages.