We counted series, deciders, home-ground results and runs ourselves from all 135 series games on NRL.com's State of Origin draw. The 1980 and 1981 one-off games and the 1987 exhibition in Long Beach, California, are left out.
State of Origin series won by Queensland and New South Wales
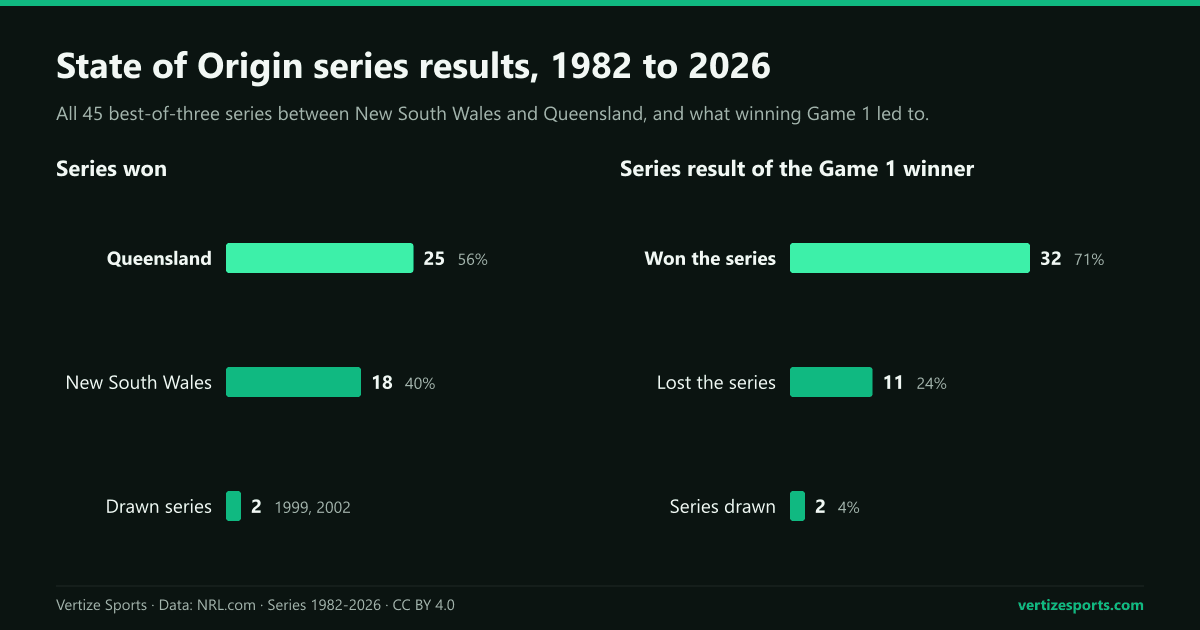
Across the 45 series, the Queensland Maroons have won 25 and the New South Wales Blues 18. Game by game it is closer: Queensland have won 71 series games and New South Wales 62, with two draws.
The lead was built in two bursts. Queensland won six of the eight series of the 1980s and the eight in a row from 2006 to 2013. Outside those years New South Wales have had the better of it, including six of the 10 series of the 1990s. Since Queensland's run ended, the count is seven series to Queensland and six to New South Wales.
Two series were drawn, in 1999 and 2002: each state won a game and the third ended level, 10-10 and 18-18. Both times the holders kept the shield, and the holders were Queensland.
Seven series ended in a 3-0 whitewash: Queensland in 1988, 1989, 1995 and 2010, and New South Wales in 1986, 1996 and 2000.
How often the Game 1 winner wins the State of Origin series
The Game 1 winner has won 32 of 45 series, 71 percent, lost 11 and drawn two. That record sits between the World Series, where the Game 1 winner has won 63 percent of the time since 1903, and the NBA playoffs, where Game 1 winners have won 77 percent of series since 1984.
The edge disappears once the series is level. The 20 teams that won the first two games all won the series, 11 from New South Wales and nine from Queensland. In the 25 series where the Game 1 winner lost Game 2, the Game 1 winner went on to win 12, lose 11 and draw two: once level, Game 1 counted for nothing.
The 11 teams that lost Game 1 and won the series were Queensland seven times (1982, 1987, 2006, 2008, 2013, 2017 and 2025) and New South Wales four times (1994, 2005, 2019 and 2024).
How often a State of Origin series goes to a decider
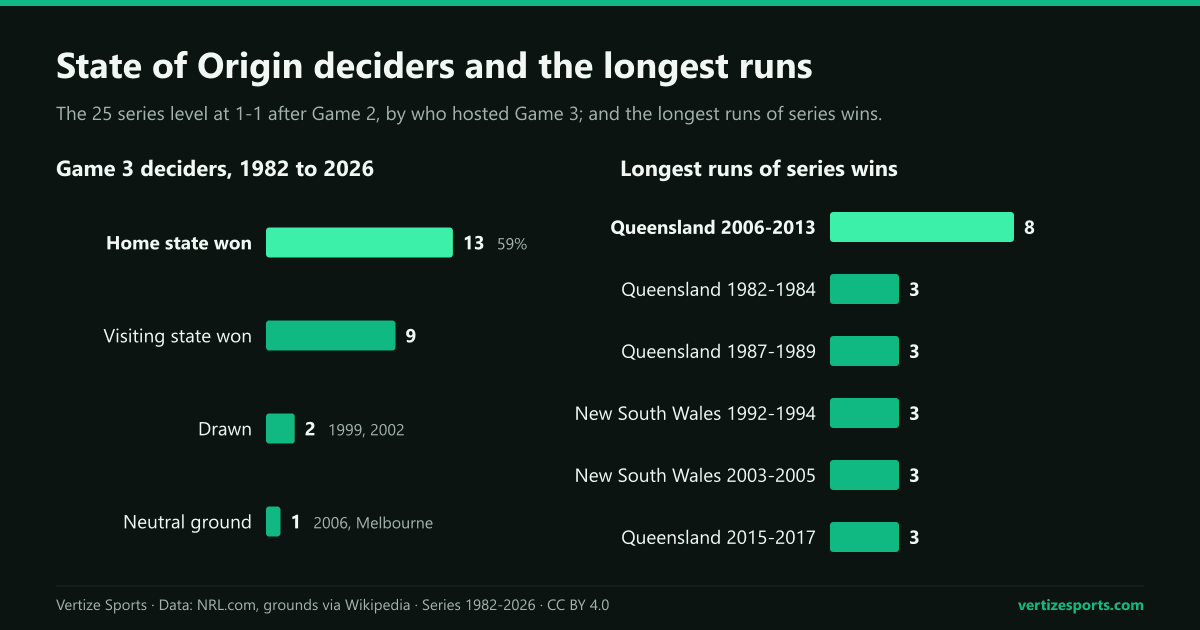
25 of the 45 series, 56 percent, were level at 1-1 after Game 2 and went to a deciding third game. Queensland have been much better in those games: they won 16 of the 25 deciders, New South Wales won seven, and two were drawn. New South Wales have won more of their series in two games, 11 of 18.
Home ground has helped in deciders, but not decisively. In the 24 deciders at a ground in New South Wales or Queensland, the home state won 13, the visitors nine, and two were drawn: 59 percent of the results went to the hosts. The other decider, in 2006, was in Melbourne, and Queensland won it 16-14.
- Queensland hosted 15 deciders and won 10, lost four and drew one. New South Wales won deciders in Queensland in 1994, 2005, 2024 and 2026.
- New South Wales hosted nine deciders and won three, lost five and drew one. Queensland won deciders in New South Wales in 1982, 1998, 2008, 2013 and 2025.
- The last three deciders went to the visitors: New South Wales in Brisbane in 2024, Queensland in Sydney in 2025 and New South Wales in Brisbane in 2026.
State of Origin home-ground record in Game 3
Counting every Game 3, deciders and dead rubbers, the side playing in its own state has won 25, lost 17 and drawn two, 60 percent of the results. In all 119 series games at a ground in either state, the home state won 70, lost 47 and drew two, also 60 percent. The 16 games played outside the two states, in Melbourne, Perth and Adelaide, split eight apiece.
Hosting has changed over time. From 1982 to 1987 Queensland hosted two of the three games every year, which is part of why 15 deciders were played in Queensland and only nine in New South Wales. Since then the states have mostly alternated, with one game often taken to Melbourne, Perth or Adelaide. In 2021 all three games were in Queensland, in Townsville, Brisbane and on the Gold Coast.
| Year | Series | Game 1 | Decider | Game 3 (ground) |
|---|---|---|---|---|
| 2026 | NSW 2-1 | NSW | Yes | NSW (Qld) |
| 2025 | Qld 2-1 | NSW | Yes | Qld (NSW) |
| 2024 | NSW 2-1 | Qld | Yes | NSW (Qld) |
| 2023 | Qld 2-1 | Qld | No | NSW (NSW) |
| 2022 | Qld 2-1 | Qld | Yes | Qld (Qld) |
| 2021 | NSW 2-1 | NSW | No | Qld (Qld) |
| 2020 | Qld 2-1 | Qld | Yes | Qld (Qld) |
| 2019 | NSW 2-1 | Qld | Yes | NSW (NSW) |
| 2018 | NSW 2-1 | NSW | No | Qld (Qld) |
| 2017 | Qld 2-1 | NSW | Yes | Qld (Qld) |
| 2016 | Qld 2-1 | Qld | No | NSW (NSW) |
| 2015 | Qld 2-1 | Qld | Yes | Qld (Qld) |
| 2014 | NSW 2-1 | NSW | No | Qld (Qld) |
| 2013 | Qld 2-1 | NSW | Yes | Qld (NSW) |
| 2012 | Qld 2-1 | Qld | Yes | Qld (Qld) |
| 2011 | Qld 2-1 | Qld | Yes | Qld (Qld) |
| 2010 | Qld 3-0 | Qld | No | Qld (NSW) |
| 2009 | Qld 2-1 | Qld | No | NSW (Qld) |
| 2008 | Qld 2-1 | NSW | Yes | Qld (NSW) |
| 2007 | Qld 2-1 | Qld | No | NSW (Qld) |
| 2006 | Qld 2-1 | NSW | Yes | Qld (Vic) |
| 2005 | NSW 2-1 | Qld | Yes | NSW (Qld) |
| 2004 | NSW 2-1 | NSW | Yes | NSW (NSW) |
| 2003 | NSW 2-1 | NSW | No | Qld (Qld) |
| 2002 | Drawn | NSW | Yes | Draw (NSW) |
| 2001 | Qld 2-1 | Qld | Yes | Qld (Qld) |
| 2000 | NSW 3-0 | NSW | No | NSW (NSW) |
| 1999 | Drawn | Qld | Yes | Draw (Qld) |
| 1998 | Qld 2-1 | Qld | Yes | Qld (NSW) |
| 1997 | NSW 2-1 | NSW | No | Qld (NSW) |
| 1996 | NSW 3-0 | NSW | No | NSW (Qld) |
| 1995 | Qld 3-0 | Qld | No | Qld (Qld) |
| 1994 | NSW 2-1 | Qld | Yes | NSW (Qld) |
| 1993 | NSW 2-1 | NSW | No | Qld (Qld) |
| 1992 | NSW 2-1 | NSW | Yes | NSW (NSW) |
| 1991 | Qld 2-1 | Qld | Yes | Qld (Qld) |
| 1990 | NSW 2-1 | NSW | No | Qld (Qld) |
| 1989 | Qld 3-0 | Qld | No | Qld (Qld) |
| 1988 | Qld 3-0 | Qld | No | Qld (NSW) |
| 1987 | Qld 2-1 | NSW | Yes | Qld (Qld) |
| 1986 | NSW 3-0 | NSW | No | NSW (Qld) |
| 1985 | NSW 2-1 | NSW | No | Qld (Qld) |
| 1984 | Qld 2-1 | Qld | No | NSW (Qld) |
| 1983 | Qld 2-1 | Qld | Yes | Qld (Qld) |
| 1982 | Qld 2-1 | NSW | Yes | Qld (NSW) |
Queensland's eight straight and the longest State of Origin runs
Queensland's eight consecutive series wins from 2006 to 2013 are the longest run in Origin history. No other team has won more than three in a row: Queensland in 1982-1984, 1987-1989 and 2015-2017, and New South Wales in 1992-1994 and 2003-2005.
The run was closer than it looks. Five of the eight series went to a decider, and New South Wales won Game 1 in 2006, 2008 and 2013. Three deciders were settled by two points or less: 16-14 at Docklands in Melbourne in 2006, 21-20 in Brisbane in 2012 and 12-10 in Sydney in 2013.
Biggest wins in State of Origin history
The biggest winning margin in a series game is Queensland's 52-6 win in Game 3 of 2015, by 46 points. The most points scored by one side is 56, by New South Wales in a 56-16 win in Game 3 of 2000. At the other end, Game 1 of 1995 finished 2-0 to Queensland, the lowest total in a series game.
| Year | Game | Result | Ground | Margin |
|---|---|---|---|---|
| 2015 | 3 | Queensland 52-6 | Suncorp Stadium (Lang Park) | 46 |
| 2021 | 1 | New South Wales 50-6 | Townsville | 44 |
| 2000 | 3 | New South Wales 56-16 | Stadium Australia | 40 |
| 2019 | 2 | New South Wales 38-6 | Perth Stadium | 32 |
| 2022 | 2 | New South Wales 44-12 | Perth Stadium | 32 |
| 1989 | 1 | Queensland 36-6 | Suncorp Stadium (Lang Park) | 30 |
State of Origin 2026 results
The 2026 series went to a decider for the third year in a row, and the visitors won it again. All three games kicked off at 8:05 pm AEST.
- Game 1, Wednesday 27 May, Stadium Australia, Sydney: New South Wales 22, Queensland 20.
- Game 2, Wednesday 17 June, MCG, Melbourne: Queensland 44, New South Wales 24, before a record Origin crowd.
- Game 3, Wednesday 8 July, Suncorp Stadium, Brisbane: New South Wales 30, Queensland 12.
Nathan Cleary scored two first-half tries in the decider and was named the 2026 Wally Lewis Medallist as player of the series. It was the 18th series win for New South Wales, their second in three years, and their third straight win at Suncorp Stadium after Game 3 of 2024 and Game 1 of 2025. Before 2024, New South Wales had not won a decider in Queensland since 2005.
Origin games do not count toward the NRL premiership. The NRL draw on Vertize and the NRL ladder cover club games only, even though some data feeds list the three Origin games beside them, and so does the NRL ladder predictor. The NRL page gathers all three, and our study of how often the NRL minor premiers win the grand final covers the club finals.
State of Origin series results: frequently asked questions
How many State of Origin series have Queensland and New South Wales won? Queensland have won 25 and New South Wales 18 of the 45 series from 1982 to 2026. The 1999 and 2002 series were drawn.
How often does the Game 1 winner win the State of Origin series? 32 times in 45, 71 percent. When the series is level after Game 2, the Game 1 winner has won 12 deciders, lost 11 and drawn two.
What is the longest winning streak in State of Origin? Queensland's eight straight series from 2006 to 2013. New South Wales' longest run is three, in 1992-1994 and 2003-2005.
What is the biggest win in State of Origin history? Queensland's 52-6 win in Game 3 of 2015, a 46-point margin. New South Wales' biggest are 50-6 in Game 1 of 2021 and 56-16 in Game 3 of 2000.
Who won State of Origin in 2026? New South Wales, 2-1. They won Game 1 22-20 in Sydney, lost Game 2 44-24 in Melbourne and won the decider 30-12 in Brisbane on 8 July.
How this was built: the score, date and designated home side of all 135 games of the 45 State of Origin series from 1982 to 2026 come from the public data behind NRL.com's draw, downloaded on 4 October 2026. The ground of each game was checked against the results table on Wikipedia, which corrects two 2002 games NRL.com files under the wrong stadium; scores agree in both sources except the 2015 Game 2, counted as 26-18. Home state means the state of the ground, not the side named as home. The 1980 and 1981 one-off games and the 1987 Long Beach exhibition are not counted.