We counted every game since 1999 in the nflverse games file, after checking each team's home, road and division records against NFL.com's standings. A tie counts as half a win, as in the standings; ties are rare, 14 at home stadiums in 27 seasons.
NFL home team win percentage by season
From 1999 to 2025, home teams went 3,873-3,002-14 at their own stadiums, 56.3 percent, and outscored visitors by 2.29 points a game: less than a field goal, in a league where about half of all games are decided by one score. Their best season was 2003 (61.6 percent), their worst 2020 (50.4).
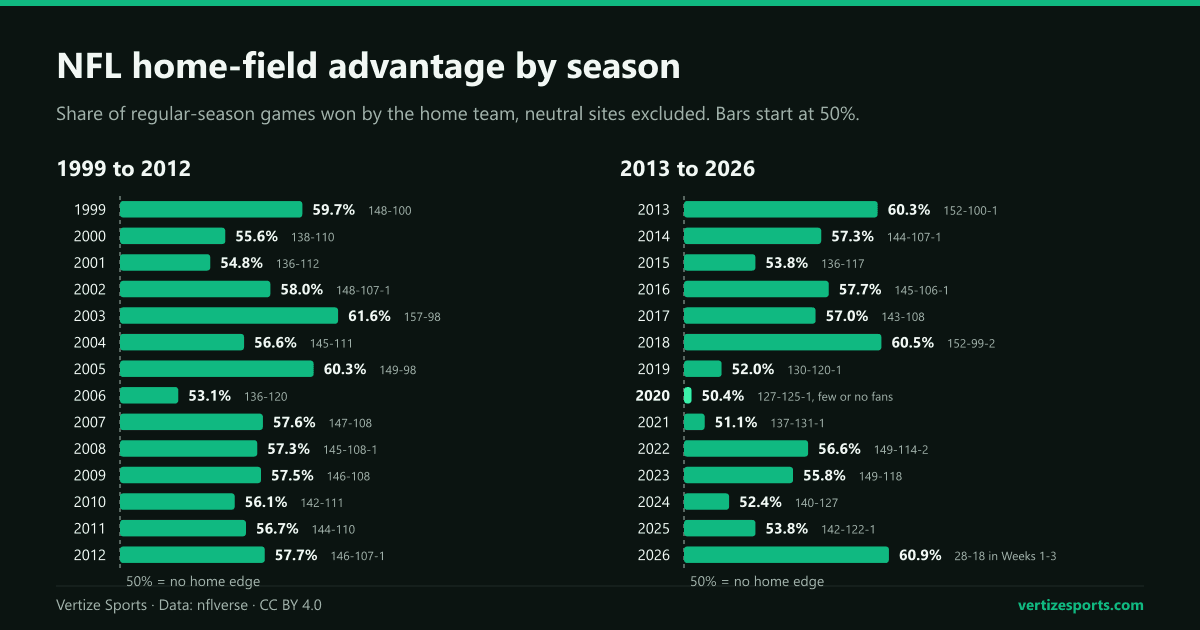
Our comparison of six leagues counted all 272 games of 2025, international ones included: NFL home teams won 53.7 percent, by 2.07 points a game. Without the seven neutral-site games, they went 142-122-1, 53.8 percent, by 2.18 points.
| Season | Home record | Home win % | Avg. home margin |
|---|---|---|---|
| 1999 | 148-100 | 59.7% | +3.06 |
| 2000 | 138-110 | 55.6% | +2.82 |
| 2001 | 136-112 | 54.8% | +2.01 |
| 2002 | 148-107-1 | 58.0% | +2.25 |
| 2003 | 157-98 | 61.6% | +3.63 |
| 2004 | 145-111 | 56.6% | +2.51 |
| 2005 | 149-98 | 60.3% | +3.92 |
| 2006 | 136-120 | 53.1% | +0.85 |
| 2007 | 147-108 | 57.6% | +2.89 |
| 2008 | 145-108-1 | 57.3% | +2.61 |
| 2009 | 146-108 | 57.5% | +2.36 |
| 2010 | 142-111 | 56.1% | +1.97 |
| 2011 | 144-110 | 56.7% | +3.22 |
| 2012 | 146-107-1 | 57.7% | +2.73 |
| 2013 | 152-100-1 | 60.3% | +3.25 |
| 2014 | 144-107-1 | 57.3% | +2.54 |
| 2015 | 136-117 | 53.8% | +1.48 |
| 2016 | 145-106-1 | 57.7% | +2.60 |
| 2017 | 143-108 | 57.0% | +2.50 |
| 2018 | 152-99-2 | 60.5% | +2.34 |
| 2019 | 130-120-1 | 52.0% | −0.05 |
| 2020 | 127-125-1 | 50.4% | +0.14 |
| 2021 | 137-131-1 | 51.1% | +1.57 |
| 2022 | 149-114-2 | 56.6% | +2.12 |
| 2023 | 149-118 | 55.8% | +2.71 |
| 2024 | 140-127 | 52.4% | +1.72 |
| 2025 | 142-122-1 | 53.8% | +2.18 |
| 2026, Weeks 1-3 | 28-18 | 60.9% | +1.41 |
Is home-field advantage declining in the NFL?
Yes. Home teams won 57.5 percent from 1999 to 2018 and 53.2 percent from 2019 to 2025, and their average margin fell from 2.58 to 1.51 points. They won less than 54 percent in five of the last seven seasons, against two of the 20 before. With samples this large, chance alone would typically move the difference by about 1.4 points; the drop is 4.3.
| Seasons | Games | Home win % | Avg. margin | Division games | Other games |
|---|---|---|---|---|---|
| 2000 to 2009 | 2,529 | 57.3% | +2.58 | 54.6% | 59.1% |
| 2010 to 2019 | 2,526 | 56.9% | +2.26 | 54.9% | 58.1% |
| 2020 to 2025 | 1,586 | 53.4% | +1.75 | 54.3% | 52.9% |
| All, 1999 to 2025 | 6,889 | 56.3% | +2.29 | 54.9% | 57.2% |
Most of the drop came outside the division. In division games, home teams won 55.3 percent before 2019 and 53.8 since; in other games, 58.9 and 52.9.
NFL home-field advantage in 2020, with few or no fans
In 2020, home teams went 127-125-1 at their own stadiums, 50.4 percent, and outscored visitors by just 0.14 points a game. With the San Francisco 49ers' three home games in Arizona, moved there after Santa Clara County prohibited contact sports, the record was 127-128-1, which ProFootballTalk called the worst cumulative record for home teams in NFL history.
NFL.com counted more than 100 games with socially distanced fans that season, while many teams had no fans all season; Yahoo Sports reported that 19 franchises hosted fans. The games file has no attendance data, so 2020 cannot be split by crowd.
Empty stands are not the whole story. In 2019, before the pandemic, home teams won 52.0 percent and were outscored by 0.05 points a game at home, the only negative margin since 1999. In 2021, with full stadiums allowed in every NFL venue, they won 51.1 percent.
Rest days and domes
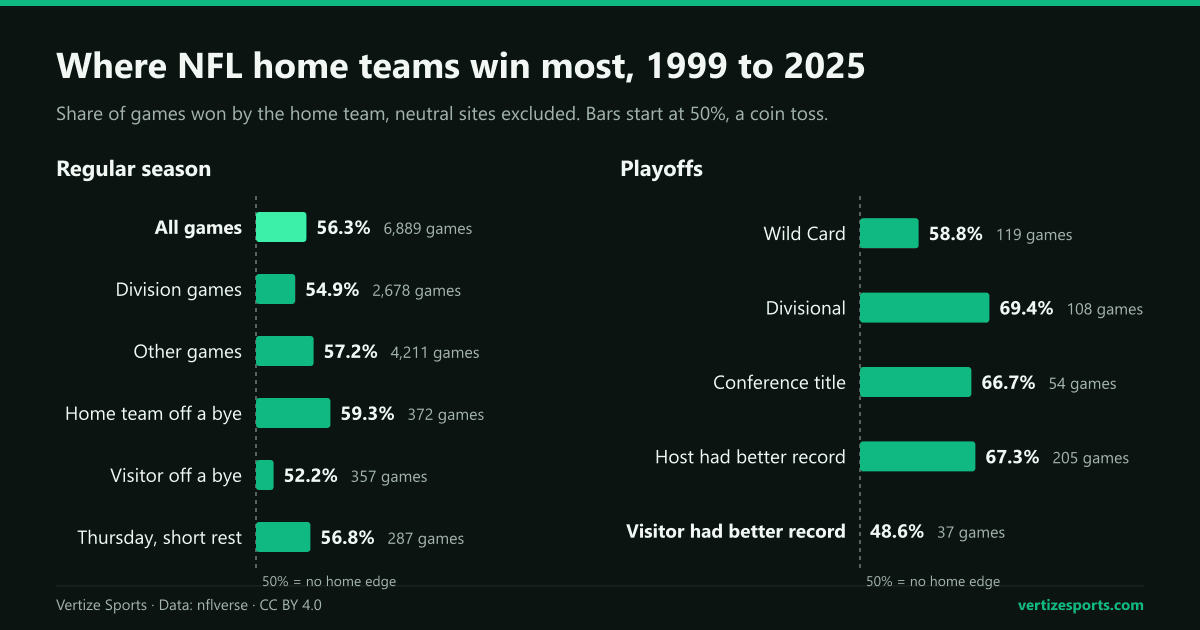
Since 1999, home teams coming off a bye won 59.3 percent of 372 games against visitors who were not; when only the visitor was, home teams won 52.2 percent of 357. That seven-point gap is about twice what chance alone would typically produce between samples this size. Thursday games with both teams on short rest look like any other: 56.8 percent.
A roof makes no visible difference. Teams that played most home games under a fixed or closed roof won 55.8 percent at home and 43.8 on the road, a 12.0-point gap; outdoor teams won 56.5 and 43.7, a 12.8-point gap. Comparing each group with itself removes team quality.
The best home teams in the NFL, 2021 to 2025
Over the last five seasons, the Buffalo Bills have the best home record, 34-7, ahead of the Kansas City Chiefs (31-11) and the Green Bay Packers (29-12). The Miami Dolphins have the biggest gap between home and road win rates, 29.2 points (28-14 against 15-25). Seven teams did better on the road, led by the New England Patriots and the Seattle Seahawks.
| Team | Home | Road | Home win % | Road win % | Gap (points) |
|---|---|---|---|---|---|
| Dolphins | 28-14 | 15-25 | 66.7% | 37.5% | +29.2 |
| Browns | 23-19 | 11-30 | 54.8% | 26.8% | +28.0 |
| Broncos | 27-16 | 15-25 | 62.8% | 37.5% | +25.3 |
| Bills | 34-7 | 25-16 | 82.9% | 61.0% | +21.9 |
| Bears | 19-22 | 12-31 | 46.3% | 27.9% | +18.4 |
| Packers | 29-12 | 21-19-1 | 70.7% | 52.4% | +18.3 |
| Giants | 16-25-1 | 9-32 | 39.3% | 22.0% | +17.3 |
| Panthers | 16-25 | 10-33 | 39.0% | 23.3% | +15.7 |
| Raiders | 19-24 | 12-30 | 44.2% | 28.6% | +15.6 |
| Jaguars | 19-19 | 15-25 | 50.0% | 37.5% | +12.5 |
| Cowboys | 27-14-1 | 23-20 | 65.5% | 53.5% | +12.0 |
| Chiefs | 31-11 | 26-15 | 73.8% | 63.4% | +10.4 |
| Falcons | 20-21 | 16-25 | 48.8% | 39.0% | +9.8 |
| Lions | 26-16 | 22-20-1 | 61.9% | 52.3% | +9.6 |
| Rams | 26-16 | 22-20 | 61.9% | 52.4% | +9.5 |
| Vikings | 26-15 | 22-18 | 63.4% | 55.0% | +8.4 |
| Steelers | 25-16-1 | 22-20 | 60.7% | 52.4% | +8.3 |
| Jets | 15-27 | 11-29 | 35.7% | 27.5% | +8.2 |
| Colts | 20-22 | 16-24-1 | 47.6% | 40.2% | +7.4 |
| Titans | 17-25 | 14-28 | 40.5% | 33.3% | +7.2 |
| Buccaneers | 24-17 | 23-20 | 58.5% | 53.5% | +5.0 |
| Texans | 20-22-1 | 19-23 | 47.7% | 45.2% | +2.5 |
| Saints | 17-23 | 18-25 | 42.5% | 41.9% | +0.6 |
| Bengals | 23-19 | 23-19 | 54.8% | 54.8% | +0.0 |
| 49ers | 26-16 | 26-16 | 61.9% | 61.9% | +0.0 |
| Eagles | 28-13 | 30-13 | 68.3% | 69.8% | −1.5 |
| Chargers | 22-20 | 23-19 | 52.4% | 54.8% | −2.4 |
| Ravens | 25-18 | 25-16 | 58.1% | 61.0% | −2.9 |
| Commanders | 17-25 | 19-22-1 | 40.5% | 46.4% | −5.9 |
| Cardinals | 13-28 | 17-26 | 31.7% | 39.5% | −7.8 |
| Seahawks | 22-20 | 27-15 | 52.4% | 64.3% | −11.9 |
| Patriots | 17-25 | 23-18 | 40.5% | 56.1% | −15.6 |
Most of those gaps are chance. With about 42 games each way, luck alone moves a team's gap by about 11 points, and the actual spread among the 32 teams, 10.8 points, is no wider. Rankings do not last: the Seahawks were tied for the biggest gap in 2006-2010 and had the second-smallest in 2021-2025, and the Baltimore Ravens went from first in 2011-2015 to 28th.
From 2002 to 2025, every team won more often at home than on the road, from the Minnesota Vikings (21.5 points) and the Ravens (21.3) to the Philadelphia Eagles (5.0), a spread still within what chance produces over 24 seasons.
NFL playoff home-field advantage by round
Since 1999, home teams have won 64.4 percent of Wild Card, Divisional and Conference Championship games, by 5.26 points a game, and unlike in the regular season the rate has held: 64.5 percent in 1999-2009, 64.0 in 2010-2019 and 64.8 since 2020.
| Playoff games | Games | Home record | Home win % | Avg. margin |
|---|---|---|---|---|
| Wild Card | 119 | 70-49 | 58.8% | +3.82 |
| Divisional | 108 | 75-33 | 69.4% | +6.49 |
| Conference championship | 54 | 36-18 | 66.7% | +5.98 |
| All three rounds | 281 | 181-100 | 64.4% | +5.26 |
| Host had the better record | 205 | 138-67 | 67.3% | +6.39 |
| Same record | 39 | 25-14 | 64.1% | +1.82 |
| Visitor had the better record | 37 | 18-19 | 48.6% | +2.68 |
The hosts are usually the better teams: seeding, with the NFL's tiebreakers for equal records, decides who plays at home. In the 37 games in which the visitor had the better regular-season record, almost all in the Wild Card round, home teams went 18-19.
The Super Bowl, a neutral-site game in nflverse, is left out. Two teams played it in their own stadium, and both won: the Tampa Bay Buccaneers, the first to play for the title at home, beat Kansas City 31-9 in February 2021, and the Los Angeles Rams beat Cincinnati 23-20 a year later.
Neutral-site and international NFL games
- 78 regular-season games from 1999 to 2025 were played away from the designated home team's stadium. Counting them as home games, as the standings do, would move the home win rate from 56.3 to 56.2 percent.
- 62 were international: 42 in London, six in Toronto, five each in Mexico City and Germany, two in Sao Paulo and one each in Dublin and Madrid. Designated home teams went 28-33-1.
- 16 were moved to another U.S. stadium, eight of them New Orleans Saints home games in 2005. Designated home teams went 4-12.
NFL home-field advantage in 2026 so far
Through Week 3, NFL.com's results give home teams a 28-18 record at their own stadiums, 60.9 percent, with an average margin of 1.41 points, their best three-week start since 2018. Both designated home teams abroad lost, the Los Angeles Rams 27-7 to San Francisco in Melbourne and the Dallas Cowboys 34-31 to Baltimore in Rio de Janeiro, so the standings show home teams at 28-20. Week 4 opens Thursday, October 1.
Three weeks say little: in 2011, home teams won 64.6 percent of the first three weeks and finished at 56.7; in 2023, 45.8 and 55.8. The NFL schedule has every result and the 224 games left, and the Vertize NFL simulator, which locks the games played, gives each home team 2.07 points a game, the 2025 figure from our six-league count.
NFL home-field advantage: frequently asked questions
How much is home-field advantage worth in the NFL? About two points a game: 2.29 since 1999, with home teams winning 56.3 percent, and 2.06 from 2021 to 2025, with 53.9 percent.
Is home-field advantage declining in the NFL? Yes: home teams won 57.5 percent from 1999 to 2018 and 53.2 percent from 2019 to 2025, mostly in games outside the division.
What was the NFL home record in 2020, with few or no fans? 127-125-1 at home stadiums, 50.4 percent, the lowest since 1999, or 127-128-1 with the 49ers' three home games in Arizona.
Which NFL team has the best home-field advantage? From 2021 to 2025, the Bills had the best home record, 34-7, and the Dolphins the biggest home-road gap, 29.2 points, but chance explains most differences between teams.
Do home teams win more in the NFL playoffs? Yes, 64.4 percent of games before the Super Bowl since 1999, mostly because the better team hosts: hosts with the worse record went 18-19.
How this was built: every regular-season and playoff game of the 1999 to 2025 seasons and Weeks 1 to 3 of 2026, from the nflverse games file, downloaded on September 30, 2026. International, Super Bowl and relocated games are kept apart, including eight 2005 Saints games at Giants Stadium, the Alamodome and LSU's Tiger Stadium and four Bills games in Toronto that the file lists as home games. Records match NFL.com's standings for all 890 team-seasons its pages list, and 2025 and 2026 scores and venues match NFL.com's schedule; playoffs were checked against Wikipedia. Week 1 is left out of rest comparisons, and playing surface entirely: the file leaves it blank for 32 home games in 2023.