We compared the AP preseason poll with the final AP poll, which has come out after the bowl games every year since 1968, for all 58 seasons from 1968 to 2025, using College Poll Archive and checking every final poll against the NCAA's Football Bowl Subdivision (FBS) record book. A team counts as ranked if it is in the poll: a Top 20 through 1988 and a Top 25 since.
How accurate the AP preseason poll has been since 1968
Its record has slipped. In the 21 seasons of the Top 20, from 1968 to 1988, an average of 13.3 of the 20 preseason teams finished ranked, 66 percent. In the 37 seasons of the Top 25, the average was 15.4 of 25, 62 percent: 64 percent through 2013 and 57 percent in the College Football Playoff era, which began in 2014. The six seasons from 2020 to 2025, at 13 of 25 a season, are the weakest six-year run since 1968.
- The best preseason poll of the Top 25 years was 1996's, with 20 of its 25 teams in the final poll.
- The worst was 2022's, with 10, followed by 2021 with 11 and 2024 with 12: the three lowest shares since 1968.
- In the Top 20 years, the count ranged from 16 teams in 1973 and 1987 to 10 in 1977 and 1983.
| Seasons | Poll size | Preseason teams that finished ranked | Per season | Preseason top-10 teams that finished unranked | Unranked preseason teams that finished in the top 10 |
|---|---|---|---|---|---|
| 1968-1988 | Top 20 | 279 of 423 (66%) | 13.3 | 39 | 37 |
| 1989-2025 | Top 25 | 571 of 925 (62%) | 15.4 | 63 | 75 |
| 2014-2025, playoff era | Top 25 | 170 of 300 (57%) | 14.2 | 25 | 25 |
| 2020-2025 | Top 25 | 78 of 150 (52%) | 13.0 | 15 | 14 |
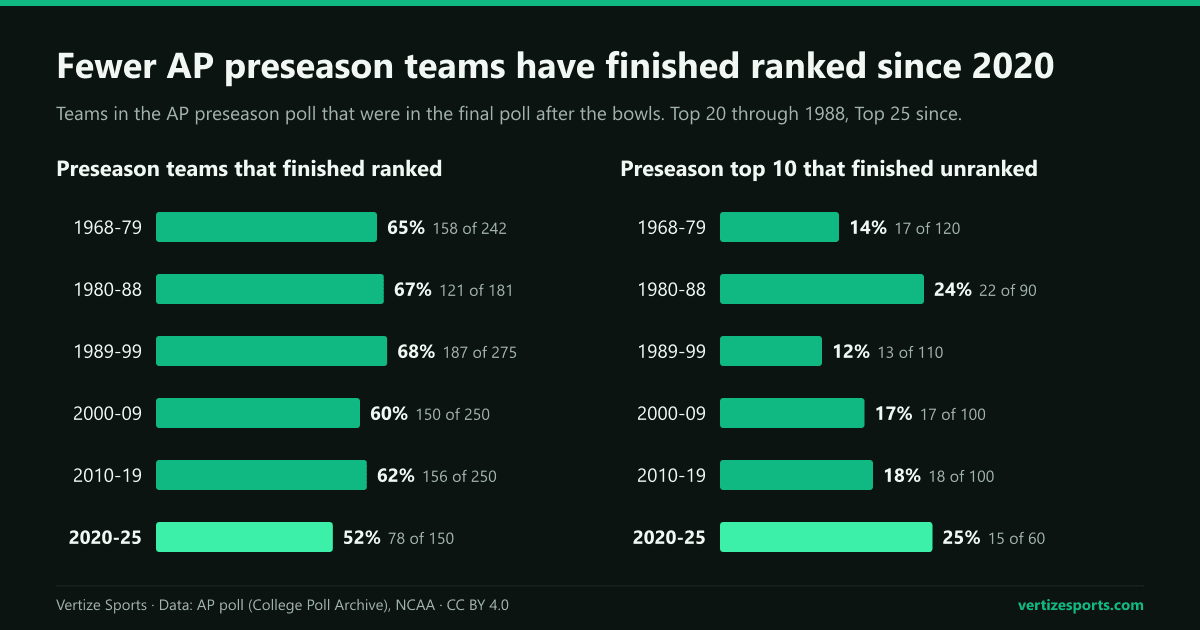
Where the AP preseason Top 25 finished in the final ranking
The higher a team starts, the likelier it is to finish ranked, and the odds fall quickly down the poll. Since 1989, 91 percent of the teams in the preseason top five were in the final poll and 70 percent finished in the top 10. Teams ranked 16th or lower in the preseason were more likely to finish unranked than ranked: 52 percent of the teams ranked 16th to 20th fell out, and five in eight of those ranked 21st to 25th. The preseason No. 1 finished ranked in 36 of 37 seasons; only 9 of the 36 teams ranked 25th did.
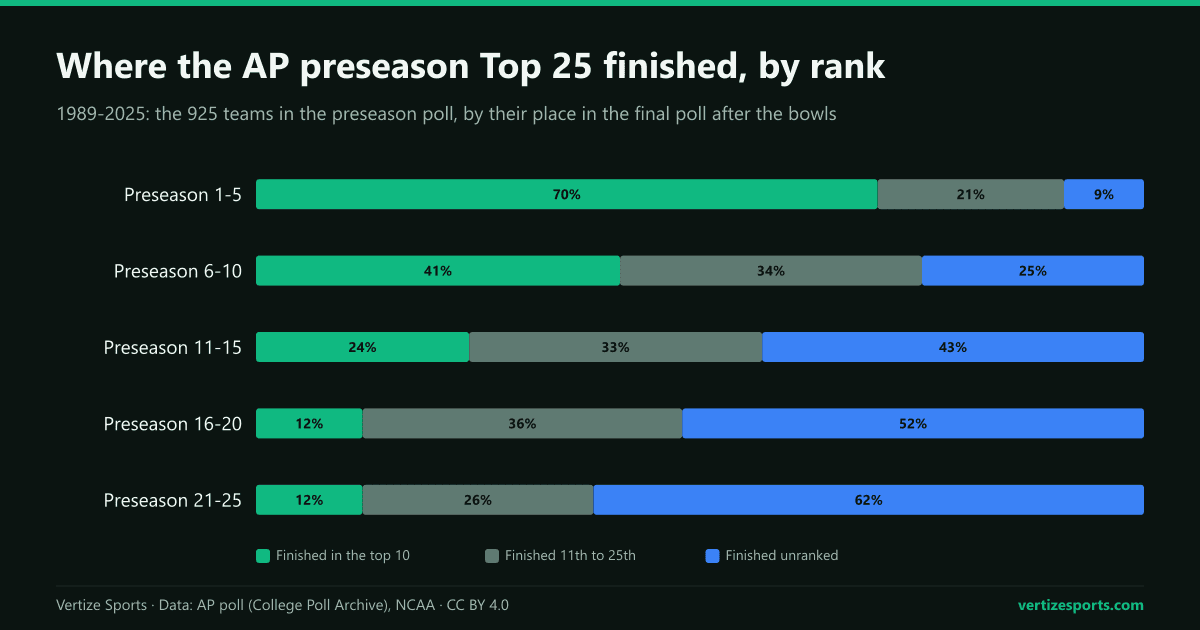
Even the teams that stayed in moved around. The 571 preseason teams that finished ranked since 1989 ended an average of 5.8 places from where they started, up or down; 36 finished exactly where they began and 120 moved 10 places or more. The biggest climb by a team ranked in both polls since 1968 was Auburn's in 2010, from 22nd to the national title, and the biggest fall was Wisconsin's in 2000, from fourth to 23rd.
Comparing teams in pairs gives a measure of the order itself. Take two teams from the same preseason poll: when one finished ahead of the other, the one ranked higher in the preseason was ahead 71 percent of the time since 1989, where a coin flip would score 50 and a perfect forecast 100. In the Top 20 years it was 65 percent.
Preseason Top 25 teams that finished unranked
About 10 a season. From 1989 to 2025, 354 of the 925 preseason teams, 9.6 a season, were missing from the final poll, and 63 of them had started in the top 10: 1.7 a season, about one in six preseason top-10 teams. In the playoff era it has been 2.1 a season.
Last season, three teams from the preseason top 10 finished unranked: Penn State, second in the preseason poll, Clemson, fourth, and Louisiana State (LSU), ninth. In 2024 it was two, Michigan, ninth, and Florida State, 10th.
The biggest drops from the preseason AP poll
The biggest belongs to Southern California (USC) in 2012, the only preseason No. 1 since 1968 to finish unranked, as we found when we measured how often the preseason No. 1 wins the national title. Sixteen teams from the preseason top five have missed the final poll since 1989, by preseason rank:
- No. 1: USC in 2012.
- No. 2: Notre Dame in 1994 and Penn State in 2025.
- No. 3: Alabama in 2000, Tennessee in 2005, Oklahoma in 2009 and Florida State in 2017.
- No. 4: Arizona in 1999, Michigan in 2005, Florida in 2010, Oklahoma in 2014, Wisconsin in 2018 and Clemson in 2025.
- No. 5: Tennessee in 2002, Texas in 2010 and Georgia in 2013.
Unranked in the preseason, top 10 at the end
It happens about twice a season. From 1989 to 2025, 75 teams that were not in the preseason poll finished in the top 10, and only 1992, 2011 and 2025 had none. The most was five, in 2022, led by Texas Christian (TCU), which went from unranked to second.
No team from outside the preseason poll has finished first since 1984, when Brigham Young (BYU) did it a year after Miami (Fla.) and three years after Clemson. Twenty-one of the 75 reached the top five:
- No. 2: Georgia Tech in 1990, Utah in 2008, Auburn in 2013 and TCU in 2022.
- No. 3: Penn State in 2005, Michigan State in 2013, TCU in 2014 and Michigan in 2021.
- No. 4: Auburn in 1993, Oregon State in 2000, Missouri in 2007, Stanford in 2010 and Notre Dame in 2012.
- No. 5: Tennessee in 1989, BYU in 1996, UCLA in 1997, West Virginia in 2005, Boise State in 2006, Texas A&M in 2012, Missouri in 2013 and Baylor in 2021.
The 2026 AP preseason Top 25 so far
Nineteen of the 25 teams in the preseason poll of Aug. 17 were still in the AP poll of Sept. 27, the last of September. Texas, fifth in the preseason, was No. 1, and Ohio State, the preseason No. 1, was fifth; Oregon, second in August, was 15th.
Six had fallen out: Texas A&M (eighth in the preseason), Oklahoma (10th), Michigan (16th), Washington (17th), Penn State (18th) and Louisville (24th). Michigan, Washington and Oklahoma each dropped out after a win. Michigan came back after beating Oklahoma 17-10, then fell out again on Sept. 27, along with Penn State, Louisville and Texas A&M, which had been 13th, 16th and 23rd the week before. Their places went to Florida, then eighth, Mississippi State, Oklahoma State, Boise State, UCLA and Kentucky, all unranked in August.
Nineteen is also the median number of preseason teams still ranked in the last poll of September from 1989 to 2025. Of the preseason teams still ranked at that point, 75 percent finished the season ranked, 514 of 685, against 57 of the 240 already out; of the 32 preseason top-10 teams that were out by then, 13 made it back into the final poll. At those rates, about 14 of this year's 19 would finish ranked and one or two of the six would return.
| Preseason | Team | Sept. 27 |
|---|---|---|
| 1 | Ohio State | 5 |
| 2 | Oregon | 15 |
| 3 | Georgia | 2 |
| 4 | Notre Dame | 3 |
| 5 | Texas | 1 |
| 6 | Indiana | 6 |
| 7 | Miami (Fla.) | 4 |
| 8 | Texas A&M | Out |
| 9 | Ole Miss | 9 |
| 10 | Oklahoma | Out |
| 11 | LSU | 11 |
| 12 | Texas Tech | 12 |
| 13 | Alabama | 7 |
| 14 | BYU | 10 |
| 14 | USC | 18 |
| 16 | Michigan | Out |
| 17 | Washington | Out |
| 18 | Penn State | Out |
| 19 | SMU | 21 |
| 20 | Tennessee | 17 |
| 21 | Utah | 13 |
| 22 | Iowa | 14 |
| 23 | Houston | 20 |
| 24 | Louisville | Out |
| 25 | Missouri | 25 |
Five weeks later, in the AP poll of Nov. 1, 17 of the 25 were ranked. Oregon and SMU had dropped out too, and Miami, seventh in August, was No. 1 at 8-0 after Texas and then Georgia lost to unranked teams in October. Utah, 21st in the preseason, was third, and UCLA, unranked in August, fifth.
The weekly poll is on our college football rankings and the games ahead on the FBS schedule. For the top spot alone, see how often the AP No. 1 loses.
AP preseason poll accuracy: frequently asked questions
How accurate is the AP preseason poll? About 62 percent of its teams are still ranked at the end of the season: 15.4 of 25 a year from 1989 to 2025, and 52 percent since 2020. Teams in the preseason top five finished ranked 91 percent of the time, teams ranked 21st to 25th 38 percent.
How many preseason Top 25 teams finish the season unranked? About 10 a season since 1989, including 1.7 from the preseason top 10. In 2022, 15 of the 25 did, the most since the poll grew to 25 teams.
Has a team unranked in the preseason finished in the top 10? Seventy-five times from 1989 to 2025, about twice a season. Four went on to finish second, most recently TCU in 2022, and the last to finish first was BYU in 1984.
What is the biggest drop from the preseason AP poll? USC in 2012, the only preseason No. 1 since 1968 to finish unranked. Since 1989, Notre Dame in 1994 and Penn State in 2025 went from No. 2 to unranked.
How many 2026 preseason Top 25 teams were still ranked in November? Seventeen of 25 in the AP poll of Nov. 1, two fewer than in the last poll of September. Oregon, Texas A&M, Oklahoma, Michigan, Washington, Penn State, SMU and Louisville had dropped out.
How this was built: the preseason and final AP polls of every season from 1968 to 2025, from College Poll Archive. A preseason team finished ranked if it was in that season's final poll, a Top 20 through 1988 and a Top 25 since, ties included. Every final poll matches the NCAA record book's lists except in 1970 and 2013, where the book leaves out Ole Miss, tied for 20th, and USC, 19th. The change in rank covers teams ranked in both polls. The pair comparison counts every pair of teams with different preseason ranks and leaves out pairs that finished level, almost always both unranked; it is Goodman and Kruskal's gamma, 0.41 for 1989-2025, expressed as a probability. The September figures use the last AP poll of September of each season from 1989 to 2025. 2026: the polls of Aug. 17 through Sept. 27, checked against NCAA.com, and the poll of Nov. 1, from ESPN.