Run differential, runs scored minus runs allowed, is the simplest measure of how good a baseball team has been. We took the final standings of every season since 2000 from MLB's Stats API, without the 60-game 2020 season, to measure how many wins a run is worth, how well the Pythagorean formula turns runs into a record, and whether the teams that beat it do it again.
How many wins a run of differential is worth in MLB
On average, 0.098 wins. A team that outscored its opponents by 100 runs won about 91 games, one outscored by 100 about 71, and run differential alone accounts for 88 percent of the variation in wins. The last playoff team has usually needed about 87 wins, which on this scale is a differential of about +61.
That is the old rule of thumb of ten runs to a win almost exactly: 10.2 runs per win. FanGraphs notes that the ratio depends on how much the league scores, but here the effect is small: the 13 highest-scoring seasons, at 4.75 runs per team per game, needed 10.2 runs per win, and the 13 lowest-scoring, at 4.35, needed 10.3.
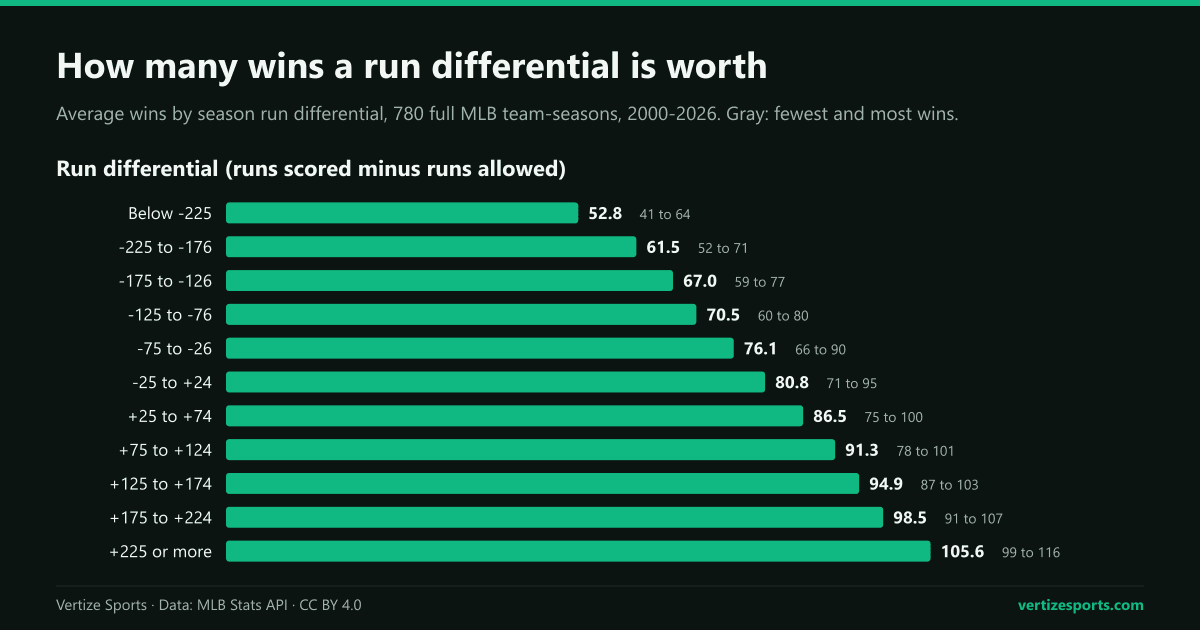
The averages hide a wide spread. Teams with a differential between -25 and +24 averaged 80.8 wins but finished anywhere from 71 to 95, and teams between +75 and +124 won anywhere from 78 to 101.
Pythagorean expectation in baseball: which exponent fits
The standard way to turn runs into an expected record is the formula developed by Bill James: runs scored squared, divided by runs scored squared plus runs allowed squared, gives the winning percentage a team should have had. Baseball-Reference uses an exponent of 1.83 instead of 2, which MLB's glossary says narrowed the formula's margin of error.
We tested every exponent from 1.40 to 2.30. The best fit is 1.81, and 1.83 trails it by less than a hundredth of a win; James's original 2 is measurably worse, and so is anything much below 1.75.
| Exponent | Typical miss (wins) | Within four wins |
|---|---|---|
| 2 (Bill James's original) | 4.26 | 66% |
| 1.83 (Baseball-Reference) | 4.10 | 67% |
| 1.81 (best fit here) | 4.10 | 67% |
| 1.75 | 4.12 | 67% |
| 1.50 | 4.51 | 63% |
| Straight line, 0.098 wins per run | 4.10 | 68% |
The best exponent drifts by decade, from 1.94 in 2000-2009 to 1.77 in 2010-2019 and 1.72 since 2021, but using 1.83 throughout never costs more than 0.07 wins of accuracy. A straight line, 81 wins plus 0.098 per run, does just as well for real teams. With 1.83, two teams in three finished within four wins of their expected record, and 13 of the 780 missed by ten or more.
The MLB teams that beat their run differential, and those that fell short
| Team | Record | Run diff. | Expected | Gap | One-run games |
|---|---|---|---|---|---|
| 2021 Seattle Mariners | 90-72 | -51 | 76-86 | +14.2 | 33-19 |
| 2016 Texas Rangers | 95-67 | +8 | 82-80 | +13.2 | 36-11 |
| 2004 New York Yankees | 101-61 | +89 | 89-73 | +12.3 | 24-16 |
| 2008 Los Angeles Angels | 100-62 | +68 | 88-74 | +12.1 | 31-21 |
| 2017 San Diego Padres | 71-91 | -212 | 59-103 | +11.8 | 19-19 |
| 2018 Seattle Mariners | 89-73 | -34 | 77-85 | +11.6 | 36-21 |
| 2018 Los Angeles Dodgers | 92-71 | +194 | 102-61 | -9.7 | 22-22 |
| 2023 San Diego Padres | 82-80 | +104 | 92-70 | -10.0 | 9-23 |
| 2014 Oakland Athletics | 88-74 | +157 | 99-63 | -10.7 | 21-28 |
| 2006 Cleveland Indians | 78-84 | +88 | 89-73 | -10.9 | 18-26 |
| 2025 Chicago White Sox | 60-102 | -95 | 71-91 | -10.9 | 15-36 |
| 2026 Detroit Tigers | 76-86 | +71 | 89-73 | -12.6 | 17-27 |
The 2021 Seattle Mariners beat their runs by the most. Outscored by 51 runs, which projects to 76 wins, they won 90, going 33-19 in one-run games, and still missed the last American League wild card by two games. The 2016 Texas Rangers had the league's best record, 95-67, with a +8 differential and a 36-11 mark in one-run games, the best one-run record since 2000, just ahead of the 2012 Baltimore Orioles' 29-9.
Seattle appears three times in the top ten, in 2009, 2018 and 2021, and MLB's glossary uses the 2018 team, 89-73 despite allowing 34 more runs than it scored, as its example.
At the other end, the 2025 Chicago White Sox lost 102 games with runs that projected 71 wins, and the 2014 Oakland Athletics had the best differential in the majors, +157, but won 88 and needed a wild card. Nine of the ten biggest overachievers had winning records in one-run games and nine of the ten biggest underachievers had losing ones, down to the 9-23 of the 2023 San Diego Padres; the two exceptions broke even.
Luck or skill: does beating the Pythagorean record carry over?
Much of the gap is made in close games. Since 2000, 28 percent of games have been decided by one run, and a team's gap correlates at 0.66 with its record in them: a team that wins its close games and loses its blowouts wins more than its runs predict.
The gap does not last, judging by 720 pairs of consecutive full seasons for the same franchise.
- A team's gap in one season correlates at 0.09 with its gap in the next, close to none.
- One-run winning percentage correlates at 0.03 from one season to the next.
- The 48 teams that beat their expected record by six or more wins finished only 0.4 wins above it the next year on average and won 6.4 fewer games; 35 of them had a worse record.
- The 51 teams that fell six or more wins short won 6.9 more games the next season, and 36 of them improved.
That makes run differential the better guide to next season, if not by much. A team's Pythagorean winning percentage correlates at 0.56 with its record the following season, its actual record at 0.55, and used together in one regression the Pythagorean record gets almost three times the weight, 0.44 against 0.16. The Vertize MLB simulator rates teams on run differential too, using each club's runs scored minus runs allowed per game from the previous season.
Run differential vs record in 2026: every team's gap
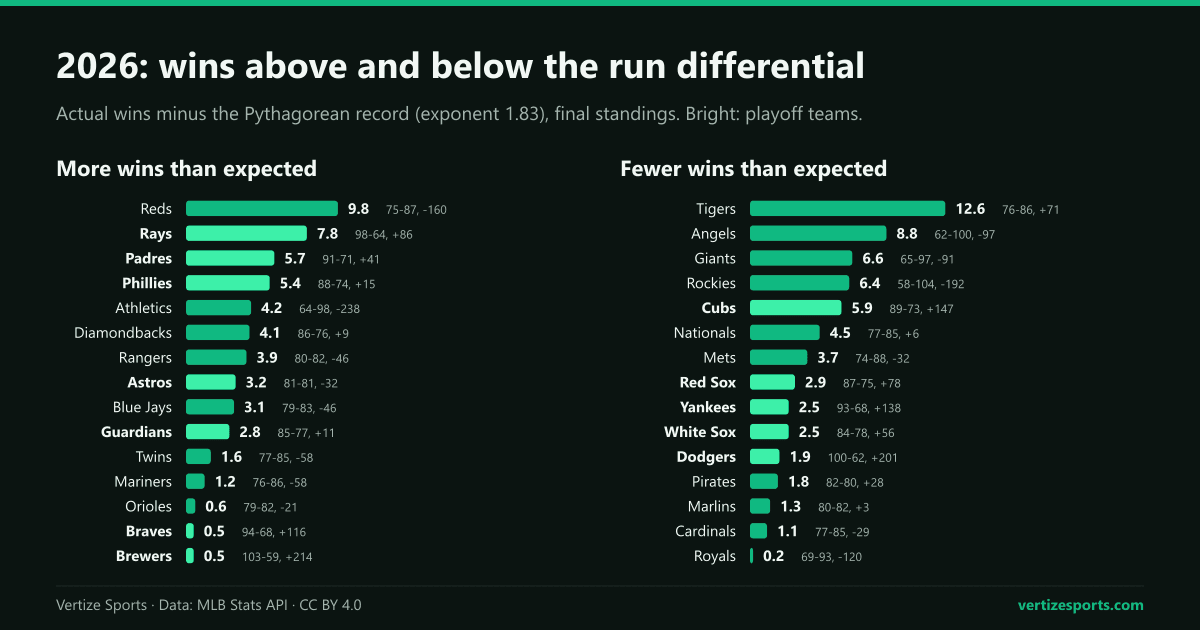
The 2026 regular season ended on Sunday, September 27, with the widest spread between records and run differentials of any full season since 2000: the gaps had a standard deviation of 4.9 wins, against 4.1 over the whole period.
| Team | Record | Run diff. | Expected | Gap |
|---|---|---|---|---|
| Cincinnati Reds | 75-87 | -160 | 65-97 | +9.8 |
| Tampa Bay Rays | 98-64 | +86 | 90-72 | +7.8 |
| San Diego Padres | 91-71 | +41 | 85-77 | +5.7 |
| Philadelphia Phillies | 88-74 | +15 | 83-79 | +5.4 |
| Athletics | 64-98 | -238 | 60-102 | +4.2 |
| Arizona Diamondbacks | 86-76 | +9 | 82-80 | +4.1 |
| Texas Rangers | 80-82 | -46 | 76-86 | +3.9 |
| Houston Astros | 81-81 | -32 | 78-84 | +3.2 |
| Toronto Blue Jays | 79-83 | -46 | 76-86 | +3.1 |
| Cleveland Guardians | 85-77 | +11 | 82-80 | +2.8 |
| Minnesota Twins | 77-85 | -58 | 75-87 | +1.6 |
| Seattle Mariners | 76-86 | -58 | 75-87 | +1.2 |
| Baltimore Orioles | 79-82 | -21 | 78-83 | +0.6 |
| Atlanta Braves | 94-68 | +116 | 93-69 | +0.5 |
| Milwaukee Brewers | 103-59 | +214 | 103-59 | +0.5 |
| Kansas City Royals | 69-93 | -120 | 69-93 | -0.2 |
| St. Louis Cardinals | 77-85 | -29 | 78-84 | -1.1 |
| Miami Marlins | 80-82 | +3 | 81-81 | -1.3 |
| Pittsburgh Pirates | 82-80 | +28 | 84-78 | -1.8 |
| Los Angeles Dodgers | 100-62 | +201 | 102-60 | -1.9 |
| Chicago White Sox | 84-78 | +56 | 87-75 | -2.5 |
| New York Yankees | 93-68 | +138 | 96-65 | -2.5 |
| Boston Red Sox | 87-75 | +78 | 90-72 | -2.9 |
| New York Mets | 74-88 | -32 | 78-84 | -3.7 |
| Washington Nationals | 77-85 | +6 | 82-80 | -4.5 |
| Chicago Cubs | 89-73 | +147 | 95-67 | -5.9 |
| Colorado Rockies | 58-104 | -192 | 64-98 | -6.4 |
| San Francisco Giants | 65-97 | -91 | 72-90 | -6.6 |
| Los Angeles Angels | 62-100 | -97 | 71-91 | -8.8 |
| Detroit Tigers | 76-86 | +71 | 89-73 | -12.6 |
Detroit had the American League's fourth-best run differential and finished fourth in the AL Central. Its runs point to an 89-73 team, enough to win the division, and it went 17-27 in one-run games. FanGraphs' Jay Jaffe ranked the gap among the largest of the Wild Card era in early September; at 12.6 wins, it is the largest shortfall of any team since 2000.
The Cincinnati Reds were the mirror image: the third-worst run differential in the majors, -160, which projects to 65 wins, yet they won 75, more than six other teams, with a 26-17 record in one-run games. Their 9.8-win surplus ranks 11th among all teams since 2000.
Among the playoff teams, the Milwaukee Brewers, the Los Angeles Dodgers and the Atlanta Braves finished within two wins of their expected records. The Tampa Bay Rays took the American League's top seed at 98-64, 7.8 wins better than their runs, while the New York Yankees, at +138, had the league's best expected record by more than five wins and are the fourth seed.
The Wild Card Series starts on Tuesday, with the San Diego Padres (91-71, +41) hosting the Chicago Cubs (89-73, +147), who outscored their opponents by 106 more runs. Picked on expected records under the same format, the field would keep 10 of its 12 teams: Detroit would replace the Cleveland Guardians, Central champions at 85-77 and +11, and the Pittsburgh Pirates (82-80, +28) would take the last National League wild card from the Philadelphia Phillies (88-74, +15). Our World Series odds use the same run differentials.
Run differential and wins: frequently asked questions
How many runs is a win worth in baseball? About ten. From 2000 to 2026, each run of differential was worth 0.098 wins, one win per 10.2 runs, so a +100 differential meant about 91 wins.
What is the Pythagorean expectation in baseball? An estimate of a team's winning percentage from its runs alone: runs scored raised to a power, divided by runs scored plus runs allowed raised to the same power. Bill James used 2; Baseball-Reference uses 1.83.
What is the best Pythagorean exponent for MLB? From 2000 to 2026, 1.81, with 1.83 practically identical: both miss a typical team's record by 4.1 wins, against 4.3 for an exponent of 2.
Which MLB team beat its run differential by the most? Since 2000, the 2021 Seattle Mariners, who won 90 games with runs that projected 76. The largest shortfall is the 2026 Detroit Tigers', 12.6 wins.
Is beating your Pythagorean record a skill? Mostly not. A team's gap correlates at 0.09 with its gap the next season, and teams six or more wins above their expected record won 6.4 fewer games the following year on average.
How this was built: final regular-season standings for 2000 to 2026 from MLB's Stats API, with wins, losses, runs scored and allowed and one-run records. The 60-game 2020 season is left out, leaving 780 team-seasons. Expected wins are the Pythagorean winning percentage with a 1.83 exponent times games played; the gap is actual minus expected wins. Wins per run is the least-squares slope of wins on run differential, both per 162 games, and exponents from 1.40 to 2.30 were compared by root-mean-square error. MLB's own expected record, in the same feed, agrees with ours within one win for all 810 team-seasons.