We matched every NBA team's record from 1996-97 to 2025-26 with its record the season before, using NBA.com's official standings and game logs. Four seasons were shorter than 82 games: 1998-99 (50 games) and 2011-12 (66), both shortened by lockouts, 2019-20 (64 to 75) and 2020-21 (72). For those we scaled each team's winning percentage to 82 games.
The biggest turnarounds in NBA history
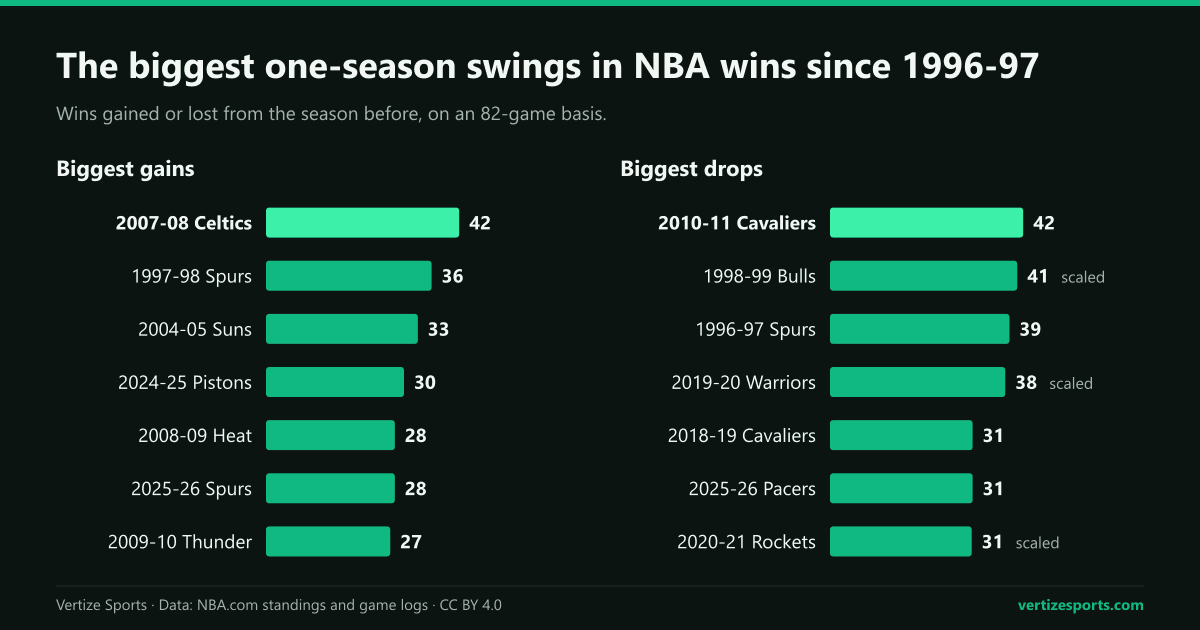
The Celtics' jump is the record. They added Kevin Garnett and Ray Allen to Paul Pierce in the summer of 2007, and the 42-win improvement broke the mark of 36 set by the 1997-98 San Antonio Spurs. The record had changed hands three times before that:
- 1979-80 Boston Celtics: 29-53 to 61-21, a 32-win gain in Larry Bird's rookie season, then the biggest ever.
- 1989-90 San Antonio Spurs: 21-61 to 56-26, a 35-win gain, the season David Robinson was the unanimous Rookie of the Year.
- 1997-98 San Antonio Spurs: 20-62 to 56-26, a 36-win gain, with No. 1 pick Tim Duncan joining Robinson, who had played six games the season before.
- 2007-08 Boston Celtics: 24-58 to 66-16, a 42-win gain, and the NBA title.
The Celtics and the 1997-98 Spurs are also first and second in our 30 seasons of data. Behind them come the 2004-05 Phoenix Suns, who brought back Steve Nash and went from 29-53 to 62-20, and the 2024-25 Detroit Pistons, from 14-68 to 44-38.
| Rank | Season | Team | Season before | Record | Wins gained |
|---|---|---|---|---|---|
| 1 | 2007-08 | Boston Celtics | 24-58 | 66-16 | +42 |
| 2 | 1997-98 | San Antonio Spurs | 20-62 | 56-26 | +36 |
| 3 | 2004-05 | Phoenix Suns | 29-53 | 62-20 | +33 |
| 4 | 2024-25 | Detroit Pistons | 14-68 | 44-38 | +30 |
| 5 | 2008-09 | Miami Heat | 15-67 | 43-39 | +28 |
| 5 | 2025-26 | San Antonio Spurs | 34-48 | 62-20 | +28 |
| 7 | 2009-10 | Oklahoma City Thunder | 23-59 | 50-32 | +27 |
| 8 | 2001-02 | New Jersey Nets | 26-56 | 52-30 | +26 |
| 8 | 2003-04 | Denver Nuggets | 17-65 | 43-39 | +26 |
| 8 | 2014-15 | Milwaukee Bucks | 15-67 | 41-41 | +26 |
The biggest drops in wins in NBA history since 1996-97
Collapses run as deep as climbs. The 2010-11 Cleveland Cavaliers lost exactly as many games as the Celtics gained, going from 61-21 to 19-63 after LeBron James left for the Miami Heat. The next three:
- 1998-99 Chicago Bulls: 62-20 to 13-37 in the lockout season, roughly 21-61 over 82 games, after Michael Jordan retired and Scottie Pippen was traded.
- 1996-97 San Antonio Spurs: 59-23 to 20-62 with Robinson out for all but six games.
- 2019-20 Golden State Warriors: 57-25 to 15-50, about 38 fewer wins at an 82-game pace, after Kevin Durant left and Klay Thompson missed the season.
Of the 33 teams that lost 20 or more wins, only one made the playoffs: the 2008-09 Detroit Pistons, who dropped from 59-23 to 39-43.
How much NBA teams change from one season to the next
Most teams move a little. The median change was 7 wins and the average 8.5. About a third of teams, 309 of 891, finished within five wins of the season before, and 64.6 percent within 10. Only 33 teams gained 20 or more and 33 lost that many.
| Change from the season before | Teams | Share |
|---|---|---|
| Gained 20 or more | 33 | 3.7% |
| Gained 10 to 19 | 120 | 13.5% |
| Gained 5 to 9 | 144 | 16.2% |
| Within 5 either way | 309 | 34.7% |
| Lost 5 to 9 | 123 | 13.8% |
| Lost 10 to 19 | 129 | 14.5% |
| Lost 20 or more | 33 | 3.7% |
Big climbs start low. Of the 33 teams that gained 20 or more wins, 16 had been under .300 the year before, and 27 made the playoffs. One that did not was the 2013-14 Phoenix Suns, who went from 25-57 to 48-34 and still missed out in the Western Conference.
How often bad NBA teams make the playoffs the next season
Not often. Of the 111 teams that finished under .300, 24 wins or fewer in an 82-game season, 11 made the playoffs the next year, 9.9 percent. As a group they went from 19.7 wins to 28.2. Most got better, 87 of 111, but 46 were still under .300 a year later and only 12 had a winning record. The 11 that made it:
- 1997-98 San Antonio Spurs (20-62 to 56-26), 2003-04 Denver Nuggets (17-65 to 43-39), 2004-05 Chicago Bulls (23-59 to 47-35)
- 2007-08 Boston Celtics (24-58 to 66-16), 2008-09 Miami Heat (15-67 to 43-39), 2009-10 Oklahoma City Thunder (23-59 to 50-32)
- 2013-14 Charlotte Bobcats (21-61 to 43-39), 2014-15 Milwaukee Bucks (15-67 to 41-41), 2020-21 Atlanta Hawks (20-47 to 41-31)
- 2024-25 Detroit Pistons (14-68 to 44-38) and 2025-26 Philadelphia 76ers (24-58 to 45-37)
The play-in tournament has opened the door a little wider. Before it, 8 of 87 such teams made the next playoffs. Since 2020-21, 6 of 24 have at least reached the play-in, and 3 made the playoffs: the Hawks and the Pistons directly, and the 76ers through the play-in.
The Pistons are the extreme case. Their 14 wins in 2023-24 are the fewest of any team that made the next playoffs in our data, and they did it after falling to fifth in the 2024 draft lottery despite the worst record. A year later they went 60-22, a 46-win climb over two seasons, the largest since 1996-97, ahead of the 76ers' 42 from 10-72 in 2015-16 to 52-30 in 2017-18.
Regression to the mean: how much an NBA record carries over
The correlation between a team's winning percentage in one season and the next is 0.615, and on average a team keeps about 61 percent of its distance from .500. A 60-win team has typically won about 53 the next season, and a 20-win team about 28.
| Win pct. the season before | Teams | Playoffs next season | Avg. wins before | Avg. wins next season |
|---|---|---|---|---|
| Under .300 | 111 | 11 (10%) | 19.7 | 28.2 |
| .300 to .399 | 119 | 34 (29%) | 28.3 | 33.8 |
| .400 to .499 | 162 | 64 (40%) | 36.3 | 37.3 |
| .500 to .599 | 248 | 161 (65%) | 44.8 | 42.9 |
| .600 to .699 | 174 | 140 (80%) | 53.0 | 49.1 |
| .700 or better | 77 | 70 (91%) | 61.6 | 53.9 |
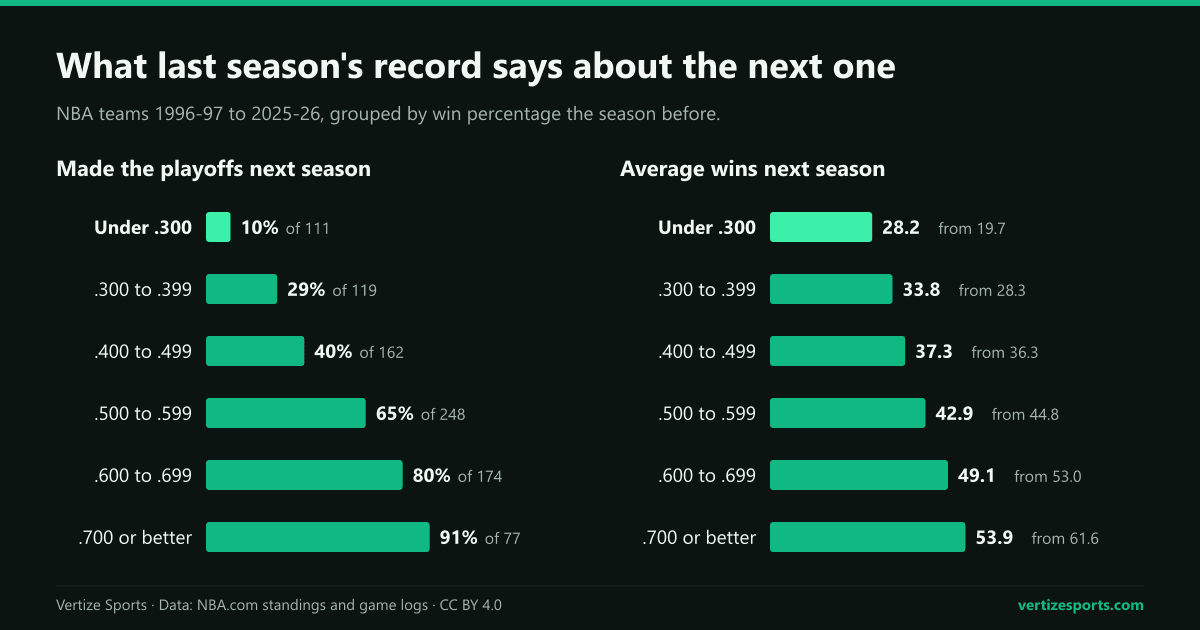
The pull works both ways. Teams at .700 or better averaged 61.6 wins and then 53.9, though 70 of 77 still made the playoffs. The first 20 games of a season show the same drift within a year.
Point differential predicts next season better than the record
Last season's point differential correlates with next season's winning percentage at 0.622, a shade above the record's 0.615. When both go into the same regression, the differential carries about twice the weight of the record. Across these seasons each point of differential per game was worth about 2.6 wins, around a .500 baseline of 41.
The clearest sign is in teams whose record and margin disagreed. The 93 teams that won at least four more games than their differential would suggest lost 3.6 wins on average the next season, 58 of them got worse, and they finished 1.5 wins below what their record alone projected. The 86 teams that won at least four fewer than their differential suggested gained 4.6 wins, 57 of them improved, and they beat their record-based projection by 2.0 wins.
That is why our 2026-27 projected wins are built on point differential. In 2025-26 the Charlotte Hornets went 44-38 while outscoring opponents by 4.8 points a game, about nine wins fewer than that margin usually brings, and the Los Angeles Lakers went 53-29 on +1.8, about seven more.
The biggest NBA turnarounds of 2025-26
Teams finished an average of 10.4 wins away from their 2024-25 records, against 8.5 over the 30 seasons; only four seasons saw more movement, and two of those were shortened. The San Antonio Spurs went from 34-48 to 62-20, the joint fifth-largest gain since 1996-97, and reached the NBA Finals, where they lost to the New York Knicks in five games.
| Team | 2024-25 | 2025-26 | Change | 2025-26 postseason |
|---|---|---|---|---|
| San Antonio Spurs | 34-48 | 62-20 | +28 | Lost NBA Finals |
| Charlotte Hornets | 19-63 | 44-38 | +25 | Lost in play-in |
| Philadelphia 76ers | 24-58 | 45-37 | +21 | Won a round |
| Toronto Raptors | 30-52 | 46-36 | +16 | Lost first round |
| Detroit Pistons | 44-38 | 60-22 | +16 | Won a round |
| Indiana Pacers | 50-32 | 19-63 | −31 | Missed playoffs |
| Memphis Grizzlies | 48-34 | 25-57 | −23 | Missed playoffs |
| Sacramento Kings | 40-42 | 22-60 | −18 | Missed playoffs |
| Milwaukee Bucks | 48-34 | 32-50 | −16 | Missed playoffs |
| Dallas Mavericks | 39-43 | 26-56 | −13 | Missed playoffs |
The Hornets gained 25 wins and went out in the play-in. The 76ers gained 21, came through the play-in and beat the Boston Celtics in seven games before the Knicks swept them. At the other end, the Indiana Pacers, Eastern Conference champions the year before, went from 50-32 to 19-63 with Tyrese Haliburton out all season after tearing his Achilles tendon in Game 7 of the 2025 Finals. Their 31-win drop ties the 2018-19 Cavaliers for the fifth-largest since 1996-97.
Five teams finished 2025-26 under .300: the Washington Wizards (17-65), the Pacers (19-63), the Brooklyn Nets (20-62), the Utah Jazz (22-60) and the Sacramento Kings (22-60). The 2026-27 season starts on Tuesday, October 20. The NBA schedule has every game, and the NBA simulator lets you play out the season yourself.
Biggest NBA turnarounds: frequently asked questions
What is the biggest turnaround in NBA history? The 2007-08 Boston Celtics went from 24-58 to 66-16, a 42-win improvement, and won the title. The previous record was 36 wins, by the 1997-98 San Antonio Spurs.
What is the biggest drop in wins in NBA history? Since 1996-97, the 2010-11 Cleveland Cavaliers, who went from 61-21 to 19-63 after LeBron James left, a 42-win fall.
How often does a bad NBA team make the playoffs the next season? About one time in ten. Of the 111 teams under .300 since 1996-97, 11 made the next playoffs; since the play-in began in 2020-21, 6 of 24 have reached at least the play-in.
Is point differential a better predictor than record in the NBA? Slightly. Teams that won at least four more games than their margin suggested fell back by 3.6 wins on average the next season.
How this was built: every NBA regular season from 1996-97 to 2025-26 and the 1995-96 final standings, from NBA.com's official standings and team game logs, 891 team seasons matched to the season before by franchise, with the 2001-02 Charlotte Hornets linked to the 2002-03 New Orleans Hornets; the 2004-05 Charlotte Bobcats, an expansion team, have no previous season. Records in 1998-99, 2011-12, 2019-20 and 2020-21 are scaled to 82 games. Making the playoffs means reaching the first round, from NBA.com's playoff and play-in logs. Point differentials are per game (for 1995-96, from the standings). Records before 1996-97 come from the Wikipedia articles linked above.