We took every regular-season game since 1996-97 from NBA.com's official game logs and recorded each team's record after 5, 10 and 20 games, its final record and whether it reached the playoffs, including through the play-in tournament since 2020-21. The counts cover the 26 full 82-game seasons, 773 team-seasons. Four shortened seasons are left out: the lockout seasons of 1998-99 and 2011-12, with 50 and 66 games; 2019-20, with no games from March 12 to July 29, 2020; and 2020-21, with 72 games.
NBA playoff odds by record after 20 games
Twenty games is about a quarter of the season, and by then both ends of the standings are mostly settled. Every team at 16-4 or better made the playoffs, and 132 of the 134 at 14-6 or better did. None of the 27 at 3-17 or worse got in.
| Record after 20 games | Teams | Made playoffs | Avg. final wins |
|---|---|---|---|
| 16-4 or better | 54 | 54 (100%) | 59.5 |
| 15-5 | 37 | 36 (97%) | 55.4 |
| 14-6 | 43 | 42 (98%) | 51.9 |
| 13-7 | 65 | 58 (89%) | 49.7 |
| 12-8 | 83 | 64 (77%) | 47.4 |
| 11-9 | 76 | 48 (63%) | 43.4 |
| 10-10 | 83 | 45 (54%) | 41.2 |
| 9-11 | 68 | 35 (51%) | 40.2 |
| 8-12 | 58 | 16 (28%) | 34.6 |
| 7-13 | 64 | 12 (19%) | 33.0 |
| 6-14 | 36 | 3 (8%) | 27.4 |
| 5-15 | 43 | 2 (5%) | 26.6 |
| 4-16 | 36 | 1 (3%) | 22.7 |
| 3-17 or worse | 27 | 0 (0%) | 19.3 |
The middle still leaves room. Teams at 10-10 made the playoffs 54 percent of the time, 45 of 83, and teams at 9-11 almost as often, 35 of 68. The drop comes one game later: 28 percent at 8-12 and 19 percent at 7-13.
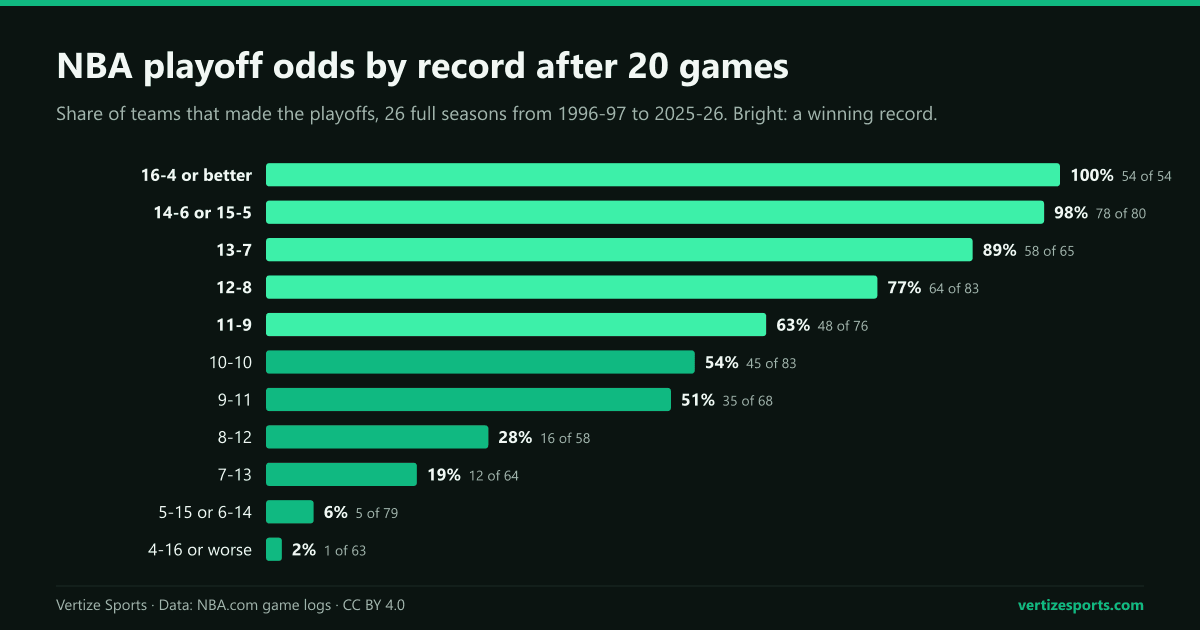
Overall, 302 of the 358 teams with a winning record after 20 games made the playoffs, 84 percent. Every playoff field but one, in 2023-24, included at least one team that had been under .500 at that point, and the 2004-05 field had six.
How much of an NBA season the first 20 games explain
The 20-game record accounts for about 70 percent of the differences in final win percentage between teams, a share statisticians call R². Part of that comes free, because those games are about a quarter of the season. Against the 62 games still to play, it explains 50 percent.
In wins, each win in the first 20 games was worth about 2.9 in the final standings: the win itself plus about 1.9 more later on. Teams at 10-10 finished with 41 wins on average, teams at 15-5 with 55 and teams at 5-15 with 27. The rule of thumb missed the final total by 5.5 wins on average, and by more than 10 for 15 percent of teams.
Teams drift back toward the middle, keeping about 60 percent of their distance from .500: a 15-5 start, a .750 pace, was followed by about .650 the rest of the way, and a 5-15 start by about .350.
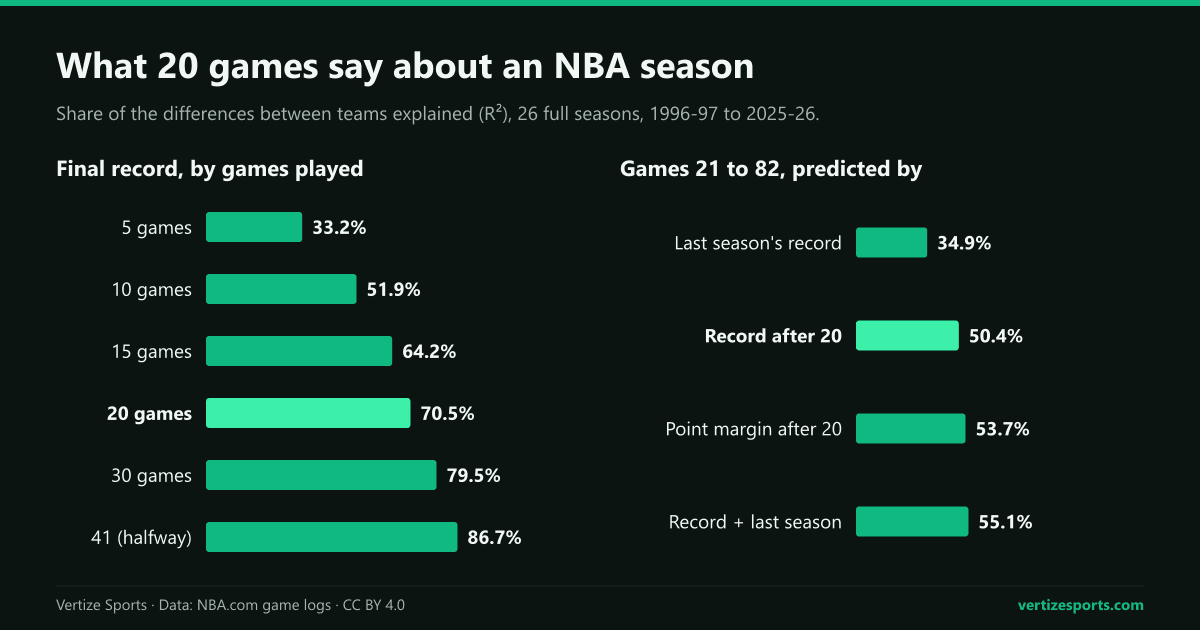
After 20 games the gains slow down. The record explained 39 percent of the rest of the season after 10 games, 50 percent after 20 and 56 percent at the halfway point. The 20-game figure has barely moved over time: between 48 and 51 percent in each of the four stretches of seasons we checked.
When an NBA record starts to count more than last season's
Early on, last season is the better guide. After five games, last season's record explained 38 percent of the rest of the new season and the new record 25 percent. They drew level at about 10 games, 37 and 39 percent, and by 20 games the new record led, 50 to 35. Adding last season's record to it raised the share only to 55 percent.
The point differential says a little more than wins and losses: after 20 games it explained 54 percent of the rest of the season. Among the 83 teams at 10-10, the 37 that had outscored their opponents finished with 42.8 wins on average and 59 percent made the playoffs; the 44 that had been outscored finished with 40.0, and 50 percent made it.
NBA record after 10 games, and what an 0-5 start means
Ten games in, the middle is wide: teams at 5-5 made the playoffs 55 percent of the time, against 87 percent at 7-3 and 19 percent at 3-7.
| Record after 10 games | Teams | Made playoffs | Avg. final wins |
|---|---|---|---|
| 10-0 | 7 | 7 (100%) | 61.9 |
| 9-1 | 27 | 26 (96%) | 55.2 |
| 8-2 | 59 | 57 (97%) | 55.5 |
| 7-3 | 91 | 79 (87%) | 50.0 |
| 6-4 | 139 | 91 (65%) | 44.7 |
| 5-5 | 137 | 76 (55%) | 41.5 |
| 4-6 | 129 | 55 (43%) | 37.5 |
| 3-7 | 80 | 15 (19%) | 32.3 |
| 2-8 | 60 | 7 (12%) | 27.0 |
| 1-9 | 37 | 2 (5%) | 23.3 |
| 0-10 | 7 | 1 (14%) | 21.1 |
Hot starts hold up. Of the 37 teams that opened 5-0, 36 made the playoffs; the exception was last season's Chicago Bulls, who finished 31-51. Teams at 8-2 or better after 10 games made it 90 times in 93.
An 0-5 start is a hole, not a verdict: 6 of 49 teams recovered to make the playoffs, 12 percent. The 1996-97 Phoenix Suns lost their first 13 games and finished 40-42, the only playoff team among the eight that have started 0-10 since 1996-97. The 2022-23 Los Angeles Lakers started 0-5, were 2-8 after 10 games, came through the play-in and reached the Western Conference finals.
NBA hot starts and the playoffs: the best records after 20 games
Nine teams were 18-2 or better after 20 games. All made the playoffs and three won the title: the 2007-08 Boston Celtics and the 2014-15 and 2021-22 Golden State Warriors. The 2015-16 Warriors opened 24-0, finished 73-9 and lost the Finals to the Cleveland Cavaliers in seven games. Last season's Oklahoma City Thunder were 19-1 after 20 games, finished 64-18 and lost the Western Conference finals to the San Antonio Spurs in seven.
Only two teams at 14-6 or better missed the playoffs: the 2010-11 Utah Jazz, who went from 15-5 to 39-43, and the 2017-18 Detroit Pistons, from 14-6 to 39-43. The 2021-22 Warriors went 35-27 after their 18-2 start, finishing further below their 20-game pace than any other playoff team, and won the title anyway.
All 26 champions were .500 or better after 20 games, 23 of them 13-7 or better. The slowest was the 2005-06 Miami Heat at 10-10, and last season's champion, the New York Knicks, were 13-7. For the regular season's best team in the playoffs, see how often the best record wins the NBA title.
Losing record after 20 games: the NBA teams that made the playoffs anyway
The 69 teams that made it from under .500 after 20 games include some long climbs:
- Chicago Bulls, 2004-05: lost their first nine games, were 5-15 after 20 and went 42-20 the rest of the way to finish 47-35, the furthest any team in the sample finished above its 20-game pace.
- Miami Heat, 2003-04: started 0-7, were 5-15 after 20, finished 42-40 and won a playoff series.
- New Orleans Pelicans, 2021-22: 4-16, the worst 20-game record of any playoff team in the sample, finished 36-46 and got in through the play-in. Before the play-in, no team below 5-15 made it.
The play-in has changed what a slow start costs. In the five full seasons since it began, 20 of the 57 teams under .500 after 20 games reached at least the play-in, 35 percent, but only 9 made the playoffs and 5 went straight to the first round. Last season the Portland Trail Blazers went from 8-12 to 42-40 and won a play-in game to get in, while the Charlotte Hornets, 6-14 and then 44-38, and the LA Clippers, 5-15 and then 42-40, went out in the play-in. The playoff line counts how many wins those places have taken.
What the first 20 games mean for the 2026-27 NBA season
The 2026-27 season tips off on Tuesday, October 20. On the official schedule, every team plays its fifth game between October 28 and November 2, its 10th between November 6 and 11 and its 20th between November 27 and December 2, the days after Thanksgiving. All of that comes before the two games per team, December 4 to 10, that depend on NBA Cup group play.
That suggests how to read the first weeks. Through 10 games, a record says about as much as last season's did, although the extremes already count: 5-0 teams have almost always made the playoffs and 0-5 teams rarely. By the 20-game mark the tables above apply, and the point differential is worth reading next to the record. Seeds 7 to 10 in each conference again go to the play-in for the last two playoff places.
Until then, our projected wins for every NBA team give the preseason view. Once games start, the NBA schedule carries every result and the NBA simulator plays out the rest of the season from the real standings.
NBA records after 10 and 20 games: frequently asked questions
How much does an NBA team's record after 20 games predict? It accounts for about 70 percent of the differences in final records and about half of those over the other 62 games. Each win in the first 20 was worth about 2.9 in the final standings.
Can a team with a losing record after 20 games make the NBA playoffs? One in five did, 69 of 332 since 1996-97. The worst record to make it was 4-16, by the 2021-22 New Orleans Pelicans through the play-in.
Can an NBA team that starts 0-5 make the playoffs? Rarely: 6 of 49 did. Of the eight teams that started 0-10 since 1996-97, only the 1996-97 Phoenix Suns got in.
Do NBA teams that start 5-0 make the playoffs? Almost always: 36 of 37 in the full seasons since 1996-97. The exception was the 2025-26 Chicago Bulls, who finished 31-51.
How this was built: every regular-season game from 1996-97 to 2025-26 in NBA.com's official game logs, 892 team-seasons, in date order; every final record matches NBA.com's standings. Playoff and play-in teams come from NBA.com's playoff and play-in game logs, and making the playoffs means reaching the first round. The counts use the 26 full seasons; adding the four shortened ones changes the share of final records explained by less than a tenth of a point. Shares explained are R² from linear regressions on win percentage. Last season's record is matched by NBA.com team ID, which leaves out the 2002-03 New Orleans Hornets and the 2004-05 Charlotte Bobcats. The Indiana Pacers' game at the Boston Celtics on April 16, 2013, was canceled, and both teams' wins are scaled to 82 in averages. The 2026-27 dates come from the official NBA schedule, retrieved September 29, 2026.