Oliver's four factors are shooting, turnovers, offensive rebounding and free throws. We computed all four for both teams in every game of NBA.com's team game logs, the data behind our NBA points per game by season, then measured how often winning each one wins the game and how much each explains a team's point differential over a season.
The four factors of basketball: the formulas we used
We use the definitions from Oliver's 2004 book Basketball on Paper as set out in a paper by Jirka Poropudas and Topi Halme, revised in October 2026, with turnovers counted per possession. Each factor is computed for a team and, the same way, for its opponents.
- Shooting, effective field-goal percentage: field goals made plus half the 3-pointers made, divided by field-goal attempts, so a three counts 1.5 times a two.
- Turnovers, turnover rate: turnovers per 100 possessions. Possessions are estimated as field-goal attempts, minus offensive rebounds, plus turnovers, plus 0.44 times free-throw attempts.
- Offensive rebounding, offensive rebounding rate: offensive rebounds divided by offensive rebounds plus the opponent's defensive rebounds.
- Free throws, free-throw rate: free throws made divided by field-goal attempts, which counts both getting to the line and making the shots.
A team wins a factor in a game when its number beats its opponent's: higher shooting, rebounding and free-throw rates, a lower turnover rate. When the two are level, neither team wins it.
What wins NBA games: how often winning each factor wins
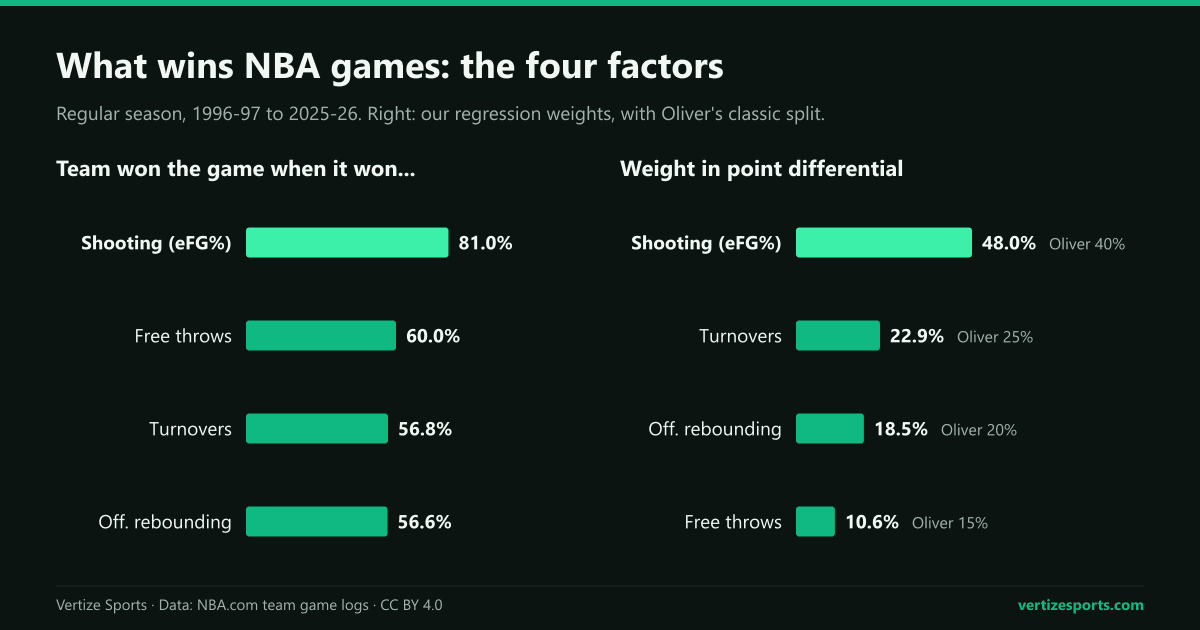
Shooting is the one factor that nearly decides a game on its own. In the 35,460 games in which one team shot better, that team won 81.0 percent of the time; the free-throw winner won 60.0 percent, the turnover winner 56.8 and the offensive rebounding winner 56.6.
The factors also add up. Teams that won three of the four won 87.0 percent of the time, and teams that won all four won 2,866 of 2,867 games. The only team to lose with all four was the Philadelphia 76ers, beaten 116-114 in overtime by the Washington Wizards on November 23, 2010.
| Factors won | Team games | Won | Lost | Win rate |
|---|---|---|---|---|
| 4 | 2,867 | 2,866 | 1 | 99.97% |
| 3 | 18,128 | 15,773 | 2,355 | 87.01% |
| 2 | 28,780 | 14,484 | 14,296 | 50.33% |
| 1 | 18,333 | 2,420 | 15,913 | 13.20% |
| 0 | 2,982 | 2 | 2,980 | 0.07% |
- Shooting alone is not enough: teams that won only the shooting factor won 41.4 percent of the time, while teams that did not win it but won the other three won 59.1 percent.
- Shooting plus turnovers, without the other two, won 77.7 percent.
- Shooting efficiency says more than threes alone: in our study of NBA 3-point attempts by season, the team that made more threes won 63.7 percent of games.
Four factors weights: how much each explains point differential
In Basketball on Paper, Oliver weighted the factors at about 40 percent for shooting, 25 for turnovers, 20 for offensive rebounding and 15 for free throws, the split Poropudas and Halme cite as Oliver's original proposal. To test it, we regressed the point differential per game of all 892 team-seasons since 1996-97 on their four margins over opponents, with every variable standardized so the coefficients can be compared. Together the four margins explain 98.2 percent of the variation in point differential, and the shooting margin alone explains 77.3 percent.
| Factor | Oliver's weight | Our weight | 1 standard deviation | Points per game |
|---|---|---|---|---|
| Shooting (eFG%) | 40% | 48.0% | 2.7 percentage points | 3.8 |
| Turnovers | 25% | 22.9% | 1.5 turnovers per 100 possessions | 1.8 |
| Offensive rebounding | 20% | 18.5% | 2.9 percentage points | 1.5 |
| Free throws | 15% | 10.6% | 0.030 FTM per FGA | 0.8 |
The order is Oliver's, but shooting weighs more than Oliver's 40 percent and free throws less than the 15 percent; counting free-throw attempts instead of makes cuts them to 8.8 percent. Poropudas and Halme, splitting offensive efficiency with a different method on NBA data from 1997 to 2025, also rank shooting first, at 45 percent, and free throws last, at 12.
Champions point the same way. Of the 30 since 1996-97, 25 ranked in the top five of their regular season in shooting margin and 10 led the league in it; 5 ranked in the top five in turnover margin, 9 in rebounding margin and 6 in free-throw margin.
Four factors trends: shooting up, offensive rebounding down and back
The league's averages have moved much more than the weights. Since 1996-97:
- Shooting: effective field-goal percentage went from a low of 46.6 percent in 1998-99 to a high of 54.7 in 2023-24, and was 54.6 in 2025-26.
- Turnovers: from 16.8 per 100 possessions in 1996-97 to a low of 13.4 in 2023-24, then 14.1 in 2025-26.
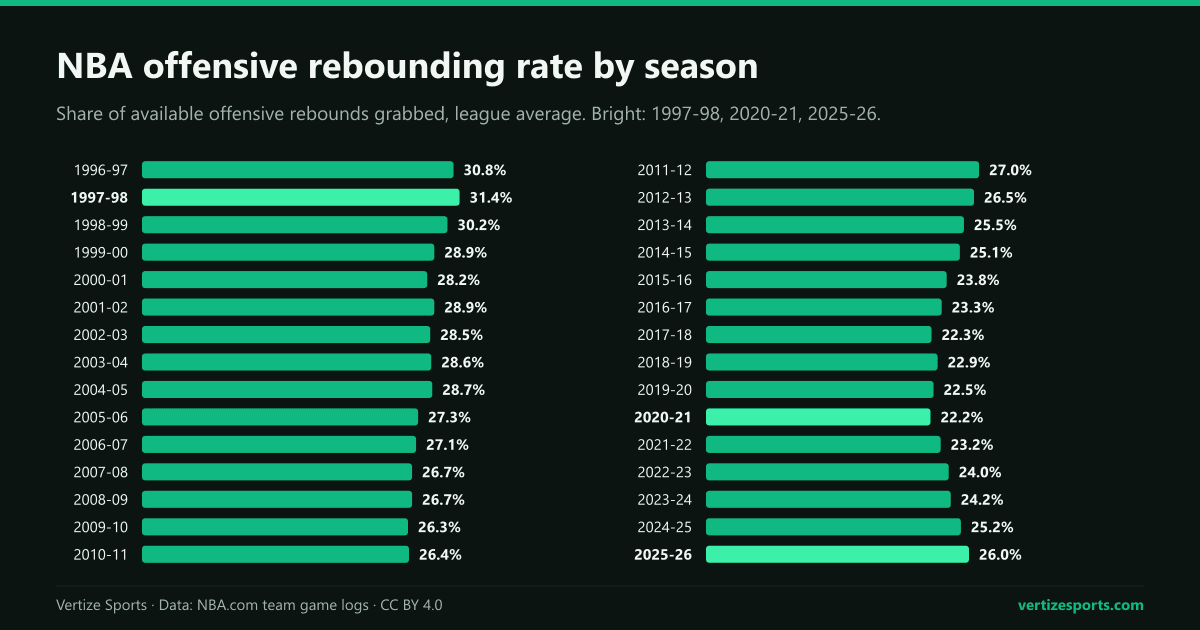
- Offensive rebounding: from 31.4 percent in 1997-98 to 22.2 in 2020-21, then up in five straight seasons to 26.0 in 2025-26, the highest since 2012-13.
- Free throws: from a high of 0.248 made per field-goal attempt in 2005-06 to a low of 0.189 in 2024-25, then 0.206 in 2025-26, when attempts rose from 21.7 a game to 23.5.
Shooting's weight rose after the first decade and has held since: 45.7 percent from 1996-97 to 2005-06, 49.6 in the next 10 seasons and 48.8 in the last 10. The weight of free throws fell from 12.6 to 8.6 percent and that of offensive rebounding rose from 16.5 to 19.8, even as teams rebounded fewer of their own misses.
| Seasons | Shooting | Turnovers | Off. rebounding | Free throws | Better shooter won |
|---|---|---|---|---|---|
| 1996-97 to 2005-06 | 45.7% | 25.1% | 16.5% | 12.6% | 80.7% |
| 2006-07 to 2015-16 | 49.6% | 20.9% | 18.6% | 10.9% | 80.7% |
| 2016-17 to 2025-26 | 48.8% | 22.8% | 19.8% | 8.6% | 81.7% |
NBA four factors 2025-26: the best and worst teams
The 2025-26 regular season ran from October 21, 2025, to April 12, 2026. The better-shooting team won 81.4 percent of games, and the team that won the offensive rebounding factor won 60.4 percent, that factor's highest rate in the 30 seasons.
| Factor | Best offense | Worst offense | Best defense | Worst defense |
|---|---|---|---|---|
| Shooting (eFG%) | Nuggets 57.7% | Nets 52.0% | Pistons 51.7% | Jazz 57.8% |
| Turnovers per 100 possessions | Thunder 12.3 | Trail Blazers 16.6 | Pistons 16.4 | Nuggets 11.6 |
| Offensive rebounding rate | Rockets 34.8% | Bucks 21.1% | Spurs 22.7% | Wizards 29.8% |
| Free throws made per FGA | Magic 0.249 | Bucks 0.163 | Spurs 0.180 | Pistons 0.251 |
- The Oklahoma City Thunder, 64-18 with the best point differential, 11.1 a game, led in shooting margin and turnover margin; they turned the ball over least, 12.3 times per 100 possessions, but ranked 28th in offensive rebounding rate.
- The Houston Rockets grabbed 34.8 percent of available offensive rebounds, the most by any team since the 2002-03 Golden State Warriors, at 35.0.
- The Detroit Pistons, 60-22 and first in the East, held opponents to the lowest shooting percentage, 51.7, and forced the most turnovers, 16.4 per 100 possessions, but allowed the most free throws, 0.251 per field-goal attempt.
- The champion New York Knicks, who beat the San Antonio Spurs in five games in the 2026 NBA Finals, ranked ninth in shooting margin; of the 30 champions only the 1997-98 Chicago Bulls ranked lower. The Knicks were third in rebounding margin, fifth in offensive and second in defensive rebounding rate.
The 2026-27 regular season opened on Tuesday, October 20. Every game is on the NBA schedule, and the NBA season simulator lets you pick results and play out the standings.
NBA four factors by season: the full table
| Season | eFG% | Turnovers per 100 | Off. rebounding | FT per FGA | Better shooter won |
|---|---|---|---|---|---|
| 2025-26 | 54.6% | 14.1 | 26.0% | 0.206 | 81.4% |
| 2024-25 | 54.3% | 14.0 | 25.2% | 0.189 | 81.8% |
| 2023-24 | 54.7% | 13.4 | 24.2% | 0.192 | 84.2% |
| 2022-23 | 54.5% | 13.8 | 24.0% | 0.208 | 80.4% |
| 2021-22 | 53.2% | 13.6 | 23.2% | 0.192 | 82.8% |
| 2020-21 | 53.8% | 13.6 | 22.2% | 0.192 | 80.5% |
| 2019-20 | 52.9% | 14.1 | 22.5% | 0.201 | 81.6% |
| 2018-19 | 52.4% | 13.7 | 22.9% | 0.198 | 81.4% |
| 2017-18 | 52.1% | 14.2 | 22.3% | 0.193 | 80.0% |
| 2016-17 | 51.4% | 14.0 | 23.3% | 0.209 | 82.5% |
| 2015-16 | 50.2% | 14.6 | 23.8% | 0.209 | 80.5% |
| 2014-15 | 49.6% | 14.8 | 25.1% | 0.205 | 82.2% |
| 2013-14 | 50.1% | 15.1 | 25.5% | 0.215 | 81.6% |
| 2012-13 | 49.6% | 15.3 | 26.5% | 0.204 | 80.9% |
| 2011-12 | 48.7% | 15.4 | 27.0% | 0.208 | 78.8% |
| 2010-11 | 49.8% | 15.0 | 26.4% | 0.229 | 82.1% |
| 2009-10 | 50.1% | 14.8 | 26.3% | 0.228 | 80.5% |
| 2008-09 | 50.0% | 14.8 | 26.7% | 0.236 | 79.4% |
| 2007-08 | 49.7% | 14.8 | 26.7% | 0.231 | 81.6% |
| 2006-07 | 49.6% | 15.9 | 27.1% | 0.246 | 78.9% |
| 2005-06 | 49.0% | 15.4 | 27.3% | 0.248 | 79.5% |
| 2004-05 | 48.2% | 15.4 | 28.7% | 0.245 | 79.0% |
| 2003-04 | 47.1% | 16.0 | 28.6% | 0.228 | 80.7% |
| 2002-03 | 47.4% | 15.8 | 28.5% | 0.229 | 81.7% |
| 2001-02 | 47.7% | 15.4 | 28.9% | 0.221 | 82.0% |
| 2000-01 | 47.3% | 15.9 | 28.2% | 0.231 | 82.0% |
| 1999-00 | 47.8% | 16.1 | 28.9% | 0.231 | 79.7% |
| 1998-99 | 46.6% | 16.6 | 30.2% | 0.240 | 80.9% |
| 1997-98 | 47.8% | 16.5 | 31.4% | 0.243 | 80.6% |
| 1996-97 | 49.3% | 16.8 | 30.8% | 0.236 | 81.3% |
NBA four factors: frequently asked questions
What are the four factors in basketball? Shooting, turnovers, offensive rebounding and free throws, measured by effective field-goal percentage, turnover rate, offensive rebounding rate and free-throw rate. Dean Oliver set them out in the 2004 book Basketball on Paper.
What are the weights of the four factors? Oliver's classic split is about 40 percent shooting, 25 percent turnovers, 20 percent offensive rebounding and 15 percent free throws. Our regression on 30 NBA seasons gives 48.0, 22.9, 18.5 and 10.6 percent.
What wins NBA games? Shooting better than the opponent, above all: the team with the higher effective field-goal percentage won 81.0 percent of regular-season games from 1996-97 to 2025-26. Teams that won three of the four factors won 87.0 percent.
What is a good effective field-goal percentage in the NBA? The league averaged 54.6 percent in 2025-26. The Denver Nuggets led at 57.7 percent and the Brooklyn Nets were last at 52.0.
How this was built: every regular-season game from 1996-97 to 2025-26 in NBA.com's team game logs (the data behind its team box scores), 35,546 games, without playoffs, the play-in or the NBA Cup final. A cancelled 2013 Celtics-Pacers game is left out, and so is a 1996-97 game, Denver at Cleveland, whose shooting lines do not add up to its score, leaving 35,545. Win rates leave out games tied in the factor compared. The regression is ordinary least squares on 892 team-seasons, point differential per game on the four margins, all standardized; a weight is a factor's standardized coefficient divided by the sum of the four. Possessions are box-score estimates; with turnovers per play (divided by field-goal attempts plus 0.44 times free-throw attempts plus turnovers) the weights are 49.8, 23.0, 16.1 and 11.0 percent. Champions come from the playoff game logs.