We counted every regular-season and playoff game since 1996-97 in NBA.com's official team game logs, 35,415 regular-season games in all, and took the home team's result and margin. Games at neutral sites are left out: the 37 played abroad, from Tokyo to Berlin, which we matched against the list of NBA Global Games, and the NBA Cup semifinals played in Las Vegas from 2023 to 2025. So are the 88 regular-season games of the 2020 bubble, which get a section of their own.
Over all 30 seasons the home team won 58.7 percent of games and outscored the visitor by 2.77 points. For 2025-26 alone the logs give 55.4 percent and 1.73 points over 1,225 games; our one-season comparison of six leagues, built from ESPN's feed, measured 55.5 percent and 1.75 points over 1,228. This article goes back further.
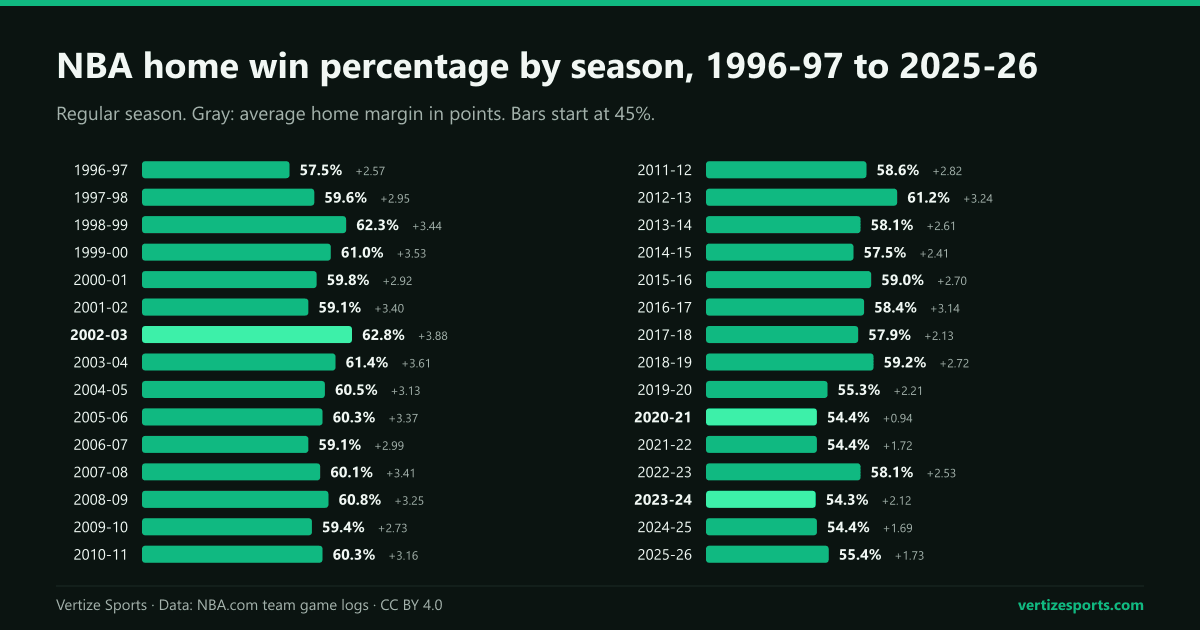
NBA home win percentage by season since 1996-97
Home court held steady for two decades and then gave ground. Before 2019-20 home teams never won less than 57.5 percent of their games in a season, and their margin never fell below 2.13 points. Since then they have topped 56 percent once, with 58.1 percent in 2022-23, and the four lowest rates of the 30 seasons, 54.3 to 54.4 percent, all came in 2020-21 or later. The peak was 2002-03: 62.8 percent and 3.88 points a game.
| Seasons | Games | Home W-L | Home win % | Home margin |
|---|---|---|---|---|
| 1996-97 to 1999-00 | 4,287 | 2,567-1,720 | 59.9% | +3.09 |
| 2000-01 to 2009-10 | 12,134 | 7,321-4,813 | 60.3% | +3.27 |
| 2010-11 to 2018-19 | 10,812 | 6,370-4,442 | 58.9% | +2.77 |
| 2019-20 (before the bubble) | 968 | 535-433 | 55.3% | +2.21 |
| 2020-21 (mostly empty arenas) | 1,080 | 587-493 | 54.4% | +0.94 |
| 2021-22 to 2025-26 | 6,134 | 3,395-2,739 | 55.3% | +1.96 |
| All 30 seasons | 35,415 | 20,775-14,640 | 58.7% | +2.77 |
The NBA is not alone. NFL home teams won 57.5 percent of games from 1999 to 2018 and 53.2 percent since, a decline that also started before the pandemic. Basketball's edge is still the larger of the two, measured as a share of games won.
The 2020 bubble and the 2020-21 empty arenas
The pandemic ran two experiments that no league would have chosen. From July 30 to August 14, 2020, 22 teams finished the 2019-20 season at Walt Disney World near Orlando, with no fans in the stands, only virtual ones on video boards, and nobody traveling between games. One team in each game was still listed as the home side.
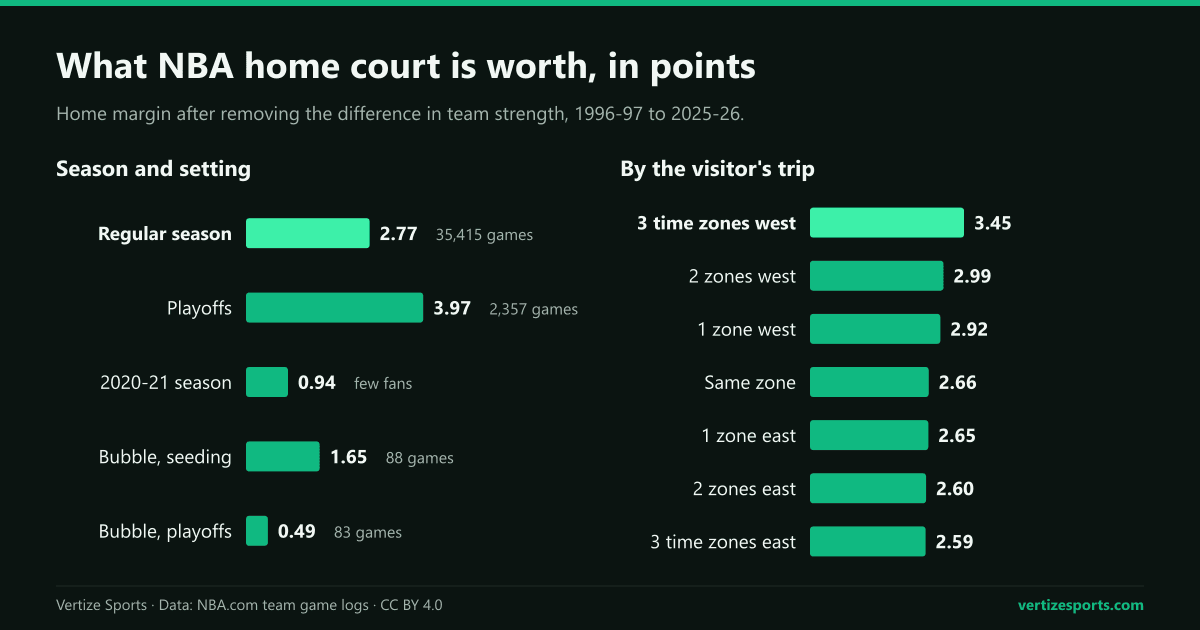
- In the 88 bubble seeding games, designated home teams went 49-39, 55.7 percent, and won by 1.65 points a game.
- In the 83 bubble playoff games they went 40-43, 48.2 percent, and after allowing for team strength were 0.49 points better than the visitor.
- Across all 171 bubble games: 89 wins, 52.0 percent, and about 1.1 points after allowing for strength, under half the regular-season edge.
Then came 2020-21: 72 games each, with most arenas closed to fans for at least part of the season and only seven teams admitting spectators, under capacity limits, from the start. The Toronto Raptors played their home games in Tampa, Florida, and went 16-20 there. Home teams still won 54.4 percent of games, but by only 0.94 points, the smallest margin in 30 seasons.
The small crowds that came back during that season did not bring the edge back with them: the home margin was 0.89 points before March 1, 2021, and 0.99 after. The following season the margin rose to 1.72 points, and it has stayed between 1.69 and 2.53 since, against an average of 3.04 from 1996-97 to 2018-19.
Home-court advantage in the NBA playoffs vs. the regular season
Home court is worth more in the playoffs. Excluding the 2020 bubble, home teams have won 1,485 of 2,357 playoff games since 1997, 63.0 percent, by an average of 4.27 points. Part of that is that the higher seed hosts more games, so we took out team strength: each game's margin minus the gap between the two teams' regular-season point differentials. What is left is 3.97 points in the playoffs against 2.77 in the regular season.
The playoff edge has shrunk as well. Home teams won 64.4 percent of playoff games from 1997 to 2019 and 57.8 percent from 2021 to 2026, with a strength-adjusted margin of 4.12 points and then 3.43. The 2026 playoffs were the weakest for hosts outside the bubble, 47-38, or 55.3 percent; the strongest were the 2008 playoffs, 64-22.
In the play-in tournament, where the higher seed always hosts, home teams are 24-12 since 2021. Baseball is the contrast: there, home teams win 54.0 percent of postseason games, barely more than in the regular season.
Best and worst home-court advantage: Denver and Utah
A team's home record mostly measures how good it is, so the fairer test of home court is the gap between its home and road win percentages. Across the league that gap is 17.3 points. Two franchises top the list: the Denver Nuggets, 23.5 points better at home, and the Utah Jazz, 22.5, followed by the Atlanta Hawks at 21.5. Measured in points instead, the two lead by more: home court has been worth 3.81 points a game to Denver and 3.74 to Utah, against 3.30 for the next team, the Indiana Pacers, and 2.77 for the league.
| Rank | Team | Home W-L | Road W-L | Home | Road | Gap (pts) |
|---|---|---|---|---|---|---|
| 1 | Denver Nuggets | 759-433 | 479-713 | 63.7% | 40.2% | +23.5 |
| 2 | Utah Jazz | 782-409 | 514-678 | 65.7% | 43.1% | +22.5 |
| 3 | Atlanta Hawks | 692-500 | 436-756 | 58.1% | 36.6% | +21.5 |
| 4 | Indiana Pacers | 749-442 | 505-684 | 62.9% | 42.5% | +20.4 |
| 5 | Cleveland Cavaliers | 716-479 | 478-711 | 59.9% | 40.2% | +19.7 |
| 28 | Toronto Raptors | 661-531 | 482-707 | 55.5% | 40.5% | +14.9 |
| 29 | Boston Celtics | 749-442 | 573-617 | 62.9% | 48.2% | +14.7 |
| 30 | Philadelphia 76ers | 646-544 | 485-709 | 54.3% | 40.6% | +13.7 |
| League | 20,775-14,640 | 14,640-20,775 | 58.7% | 41.3% | +17.3 |
The two have something in common. Denver sits at about 5,280 feet and Salt Lake City at about 4,300, so visiting teams play at altitude there. The pattern is not a quirk of one era: over the last 10 seasons Utah, 18.3 points better at home, and Denver, 17.4, are again first and second. At the other end, the Philadelphia 76ers and the Boston Celtics gained the least from home court over 30 seasons.
Single seasons tell a different story, because they mostly measure quality. The best home record since 1996-97 belongs to the 2015-16 San Antonio Spurs, 40-1. The worst belongs to the 2011-12 Charlotte Bobcats, 4-29 in a season shortened by the lockout.
Travel and time zones: Eastern teams heading west
Direction matters more than distance. With team strength taken out, a home team in the Pacific time zone hosting a team from the Eastern zone won by 3.45 points over 2,048 games, against 2.66 when both teams share a time zone. That is about 0.8 points more. When the trip went the other way, three zones east, the home edge was 2.59 points, no larger than usual.
Every westward trip shows some of it: 3.04 points for visitors who had traveled west across one to three zones, 2.62 for those who had traveled east. Leaving out Denver and Utah as hosts, to keep altitude out of it, changes little. A 7 p.m. tip in Los Angeles is 10 p.m. on an Eastern body clock, though the logs cannot say whether that is the cause.
Home court in the 2026-27 NBA season
The 2026-27 regular season starts on Tuesday, October 20, and nothing has been played yet. Three games are set for neutral sites: the Denver Nuggets and the Indiana Pacers in Mexico City on November 7, with Indiana as the listed home team, and the New Orleans Pelicans and the San Antonio Spurs in Paris on January 14 and Manchester on January 17. The NBA Cup also changes: the semifinals move to the home arena of the higher seed, so the championship game is the only one left on a neutral floor.
Our NBA season simulator gives every home team a 1.72-point head start, about what home court was worth in 2025-26, and the 2026-27 NBA schedule has every game and venue.
NBA home-court advantage: frequently asked questions
How much is home-court advantage worth in the NBA? About two points a game today. Over the last five regular seasons home teams won 55.3 percent of games by 1.96 points on average; from 1996-97 to 2012-13 they won 60.2 percent by 3.20 points.
Is home-court advantage bigger in the NBA playoffs? Yes. Home teams have won 63.0 percent of playoff games since 1997, outside the 2020 bubble, and after allowing for team strength the playoff edge is 3.97 points against 2.77 in the regular season.
Which NBA team has the best home-court advantage? The Denver Nuggets, whose home win percentage has been 23.5 points higher than their road win percentage since 1996-97, just ahead of the Utah Jazz at 22.5. Both play at altitude.
Did home teams have an advantage in the NBA bubble? Very little. Designated home teams won 89 of 171 games at Walt Disney World in 2020, 52.0 percent, and about 1.1 points a game after allowing for team strength, under half the regular-season edge.
How this was built: every NBA regular-season game from 1996-97 to 2025-26 and every playoff and play-in game through 2026, from NBA.com's official team game logs. The home team is the one NBA.com lists as home. Left out of the home and road figures: the 37 regular-season games played outside the United States and Canada, matched by date and teams against Wikipedia's list; the six NBA Cup semifinals in Las Vegas from 2023 to 2025; and the 2020 bubble, counted separately. Indiana at Boston on April 16, 2013, was canceled and never played. Strength-adjusted margins subtract the difference between the two teams' average point differentials in that regular season (for the bubble, the games before it). Time zones are each home arena's standard zone, with Phoenix counted as Mountain. 2026-27 neutral-site games are from the official NBA schedule as of September 29, 2026.