We rebuilt every postseason game since 1995, the first October of the three-division era, from MLB's Stats API, and every regular season's home and road records from the API's standings. The 35 games of the 2020 Division Series, LCS and World Series, played at neutral sites, are left out. Every series winner matches MLB.com's postseason history.
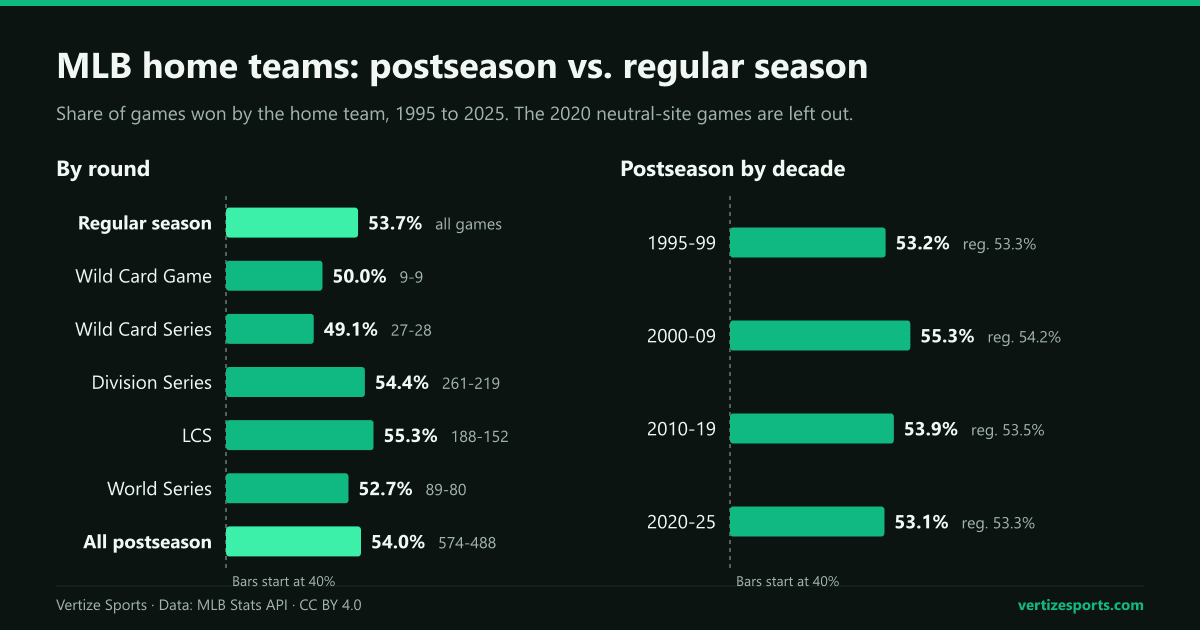
MLB home team win percentage in the playoffs, by round
The home edge is a little larger in the League Championship Series and a little smaller in the World Series, and it has vanished in the wild card round. None of the differences is large next to the noise: the 95 percent margin of error on the postseason rate runs from 51.1 to 57.0 percent, with the regular-season 53.7 well inside it.
| Round | Seasons | Home W-L | Home win % | Home-field team won series |
|---|---|---|---|---|
| Wild Card Game | 2012-2021 | 9-9 | 50.0% | 9 of 18 |
| Wild Card Series | 2020, 2022-2025 | 27-28 | 49.1% | 12 of 24 |
| Division Series | 1995-2025 | 261-219 | 54.4% | 61 of 120 |
| League Championship Series | 1995-2025 | 188-152 | 55.3% | 33 of 60 |
| World Series | 1995-2025 | 89-80 | 52.7% | 20 of 30 |
| All postseason | 1995-2025 | 574-488 | 54.0% | 126 of 234* |
| Regular season | 1995-2025 | 39215-33818 | 53.7% | - |
Inside a best-of-seven the home team's results move with the schedule. Hosts have won 57.2 percent of Games 1 and 2 and 62.7 percent of Game 6s, but only 46.7 percent of Game 4s, the one game below half; Game 7s sit at 12-11. Games 3 to 5 are hosted by the team without home field, usually the weaker one: in Game 4s the host had the better record only 17 times in 90, against 38 in 51 Game 6s. The schedule explains more of the gap than the crowd does.
Home-field advantage by decade, postseason against the regular season
Decade by decade, the postseason rate has tracked the regular season within about a point:
- 1995-1999: 53.2 percent in the postseason, 53.3 in the regular season.
- 2000-2009: 55.3 percent against 54.2, the widest gap.
- 2010-2019: 53.9 percent against 53.5.
- 2020-2025: 53.1 percent against 53.3.
Single Octobers swing far more. The regular-season rate has stayed between 52.1 and 55.9 percent in every year since 1995, but home teams went 27-11 in the 2017 postseason, 71.1 percent, and 15-26 in 2023, 36.6 percent, and they finished below .500 in eight Octobers. NFL hosts, by comparison, have won 64.4 percent of playoff games since 1999. MLB's 2026 regular season ended at 52.9 percent, close to the 52.8 percent our six-league comparison measured in mid-September.
The postseason figure also flatters home field, because the home team is usually the better team. When the host had the better regular-season record, it won 56.3 percent of games; when the visitor did, the host still won 51.6 percent. Averaging the two cancels out team quality and puts the host of an even matchup at 54.0 percent, the same as in the regular season. The team with the better record, home or away, won 52.8 percent of postseason games.
Does the team with home field win the series more often than chance?
Barely. The team that would host the last game of a series won 126 of 234 best-of-three, best-of-five and best-of-seven series, 53.8 percent. If every series were a coin flip, a split at least that lopsided would turn up 27 percent of the time, so the record cannot be told apart from chance.
That is roughly what the math predicts. Give two equal teams a 53.7 percent chance of winning at home and the one with home field wins a 2-3-2 best-of-seven 51.2 percent of the time and a best-of-five 51.4 percent; only the best-of-three with every game at one park, worth 55.5 percent, gives it real weight. Equal teams would have won about 121.5 of these 234 series for the home-field side, against the actual 126.
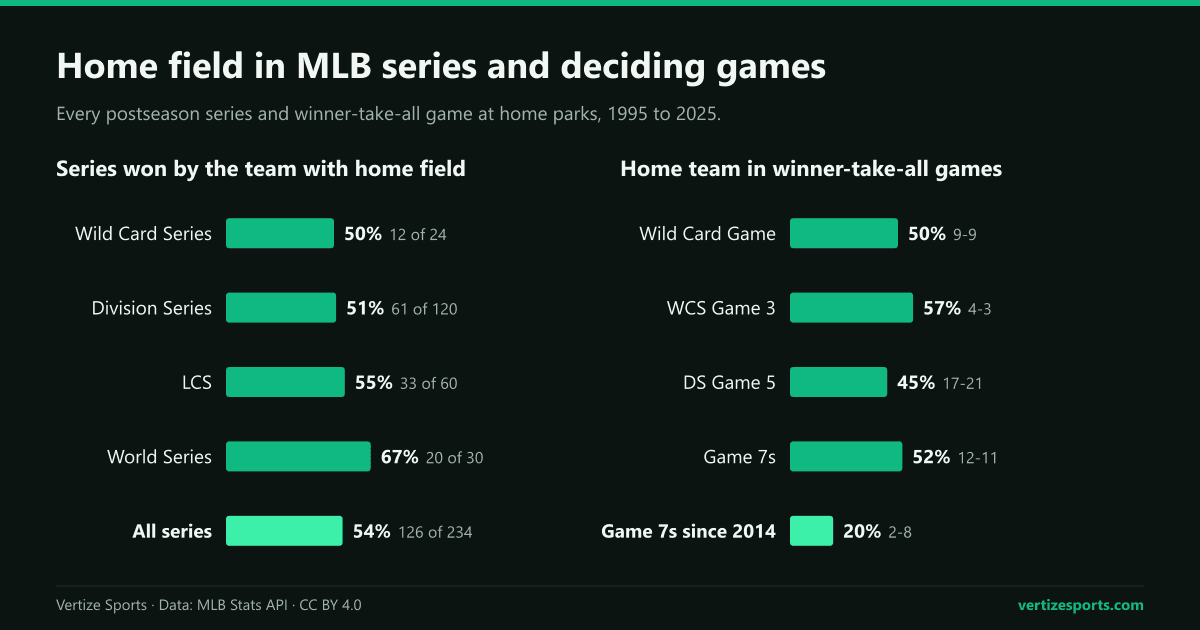
The team with home field had the better record in 198 of the 234 series; in the 30 where it had the worse record, it won 16. The team with the better record won only 119 of 228 series, 52.2 percent: short series flatten the gap.
World Series home-field advantage: before and after 2017
In the World Series, home field once had nothing to do with the standings. It alternated between the leagues through 2002 and went to the All-Star Game winner from 2003 to 2016; since 2017 it has gone to the pennant winner with the better record. In those first 22 Series the team with home field won 16, including 6 of the 7 in which it had the worse record, and home teams went 70-51 in games, 57.9 percent.
Since then the edge has disappeared. The better team has hosted all eight World Series played at home parks from 2017 to 2025 and won four, and home teams are 19-29 in those games, 39.6 percent. The 2019 Series, in which the road team won all seven games, accounts for part of that, but eight Series are too few to read as a trend.
Game 7 home team record in MLB since 1995
Home teams are 12-11 in Game 7s at their own parks since 1995: 8-6 in the League Championship Series and 4-5 in the World Series. They have lost 8 of the last 10, starting with the 2014 Kansas City Royals, and in the World Series road teams have won the last five Game 7s.
| Year | Series | Home team | Winner and score | Won by |
|---|---|---|---|---|
| 2014 | World Series | Kansas City Royals | Giants 3-2 | Road |
| 2016 | World Series | Cleveland Indians | Cubs 8-7 | Road |
| 2017 | ALCS | Houston Astros | Astros 4-0 | Home |
| 2017 | World Series | Los Angeles Dodgers | Astros 5-1 | Road |
| 2018 | NLCS | Milwaukee Brewers | Dodgers 5-1 | Road |
| 2019 | World Series | Houston Astros | Nationals 6-2 | Road |
| 2023 | ALCS | Houston Astros | Rangers 11-4 | Road |
| 2023 | NLCS | Philadelphia Phillies | Diamondbacks 4-2 | Road |
| 2025 | ALCS | Toronto Blue Jays | Blue Jays 4-3 | Home |
| 2025 | World Series | Toronto Blue Jays | Dodgers 5-4 | Road |
In all winner-take-all games, hosts are 42-44 since 1995, including 17-21 in Division Series Game 5s, 9-9 in the old one-game Wild Card Game and 4-3 in Game 3 of the Wild Card Series.
Wild Card Series home field since the 2022 format change
The 12-team format of 2022 brought back the best-of-three Wild Card Series of 2020, with all three games in the home park of the higher seed, while the top two division winners in each league get a bye, whose value we measured in our study of the MLB playoff bye. On paper this is the most home-friendly round in baseball: an equal team that wins 53.7 percent at home should take a best-of-three at home 55.5 percent of the time.
It has not worked out that way. From 2022 to 2025 the hosts won 7 of 16 Wild Card Series, never more than three in a year, and went 17-20 in the games, although they had the better record in 15 of the 16. They lost 10 of 16 Game 1s, and six series ended in a road sweep. The one host with the worse record, the 87-75 Minnesota Twins of 2023, swept the 89-73 Toronto Blue Jays. Counting 2020, when the top four seeds hosted, the hosts are 12 of 24, the same as the Wild Card Game's 9 of 18.
Home field in the 2026 MLB postseason so far
Through 9:56 p.m. ET on October 12, home teams are 15-12 in the games finished this October. Three of the four Wild Card Series hosts advanced: the New York Yankees swept the Boston Red Sox, the San Diego Padres swept the Chicago Cubs and the Atlanta Braves beat the Philadelphia Phillies in three, while the Chicago White Sox swept the Houston Astros in Houston.
All four Division Series went to the team with home field, yet hosts went 7-9 in the games. The Cleveland Guardians lost Games 1 and 2 at home to the White Sox, won twice in Chicago and took Game 5 2-0 at Progressive Field. The Milwaukee Brewers lead the Los Angeles Dodgers 2-0 in the NLCS after 2-1 and 7-4 wins at home, and the ALCS between the Tampa Bay Rays and the Guardians began on October 12 at Tropicana Field. Every series is on our 2026 MLB playoff bracket.
MLB postseason home-field advantage: frequently asked questions
Does home-field advantage matter in the MLB playoffs? A little. Home teams have won 54.0 percent of postseason games since 1995, against 53.7 percent in the regular season, and the team with home field 54 percent of series.
What is the home team's record in MLB Game 7s? 12-11 since 1995 in games at home parks, 8-6 in the League Championship Series and 4-5 in the World Series. Road teams have won 8 of the last 10.
How is home-field advantage decided in the World Series? Since 2017 it goes to the pennant winner with the better regular-season record. From 2003 to 2016 it went to the league that won the All-Star Game, and before that it alternated between the American and National Leagues.
Who has home field in the 2026 World Series? The National League champion. Both the Milwaukee Brewers (103-59) and the Los Angeles Dodgers (100-62) finished ahead of the Tampa Bay Rays (98-64) and the Cleveland Guardians (85-77), so Games 1, 2, 6 and 7 will be in the National League park whoever wins.
How this was built: every MLB postseason game from 1995 to 2025, 1,097 in all, from MLB's Stats API, grouped into series by year, round and pair of teams, with suspended games counted once; the 35 neutral-site games of 2020 are left out, leaving 1,062. The team with home field is the one that would host the last game of the series: the higher seed in the 2-2-1 and 2-3-2 formats, and the team that opened on the road in the 2-3 Division Series of 1995 to 1997 and 2012, as described by MLB.com. Regular-season rates add up every team's home record in the API's final standings, so the few games abroad with a designated home team count. Better record means a higher regular-season winning percentage. Equal-team series odds assume every game is won by the home side 53.7 percent of the time. All 259 series from 1995 to 2025 match MLB.com's history on winner and loser. 2026 results from the Stats API, as of 9:56 p.m. ET on October 12.