To measure it, we took every regular-season game in NBA.com's official game logs since 2012-13, 16,898 in all, and counted the days each team had off before each one; zero days means the second night of a back-to-back. Two shortened seasons, 2019-20 (no games from March 12 to July 29, 2020) and 2020-21 (72 games per team), count only toward the schedule history. The results cover the other 12 seasons, 14,759 games.
NBA back-to-back win percentage by days of rest
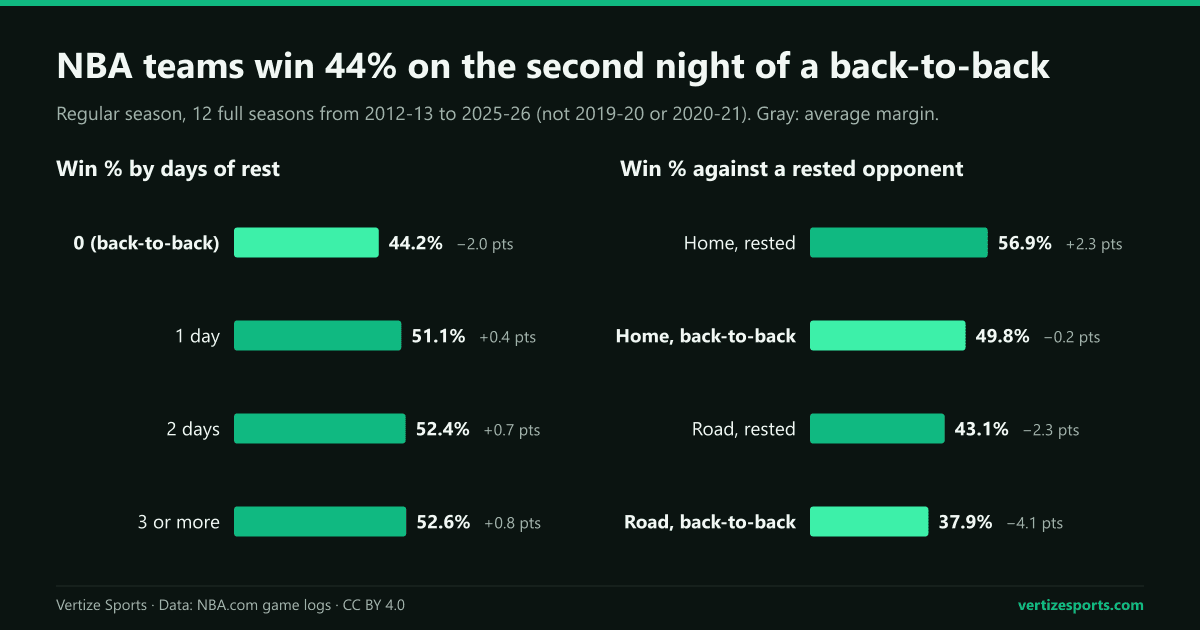
One day off is the NBA's normal rhythm. In those 12 seasons, 60.7 percent of team-games came after exactly one day of rest and 19.6 percent on the second night of a back-to-back; the other 19.7 percent followed two days off or more. The step that shows up in the results is the one from one day to none.
| Days of rest | Share of games | Win % | Avg. margin | Win % at home | Win % on the road |
|---|---|---|---|---|---|
| 0 (back-to-back) | 19.6% | 44.2% | −2.0 | 52.9% | 39.0% |
| 1 | 60.7% | 51.1% | +0.4 | 57.6% | 43.8% |
| 2 | 14.9% | 52.4% | +0.7 | 59.5% | 44.3% |
| 3 or more | 4.9% | 52.6% | +0.8 | 58.1% | 44.4% |
A second day off adds about a point of win percentage and a third adds almost nothing. Most of the value of rest is in not playing on consecutive nights: the gap between zero days and one is 6.9 points of win percentage and 2.4 points of margin.
Part of that raw gap is about venue, not fatigue: 62.9 percent of second nights were road games, against 47.6 percent of games after one day off, and road teams lose more often whatever their rest. The next comparison splits home and road.
Back-to-back against a rested opponent, at home and on the road
The clean comparison holds the venue fixed and changes only who is more tired: games in which one team was on the second night of a back-to-back and its opponent had at least a day off, against games in which both had rested.
| Situation | Games | Home team won | Avg. home margin |
|---|---|---|---|
| Both teams rested | 9,703 | 56.9% | +2.3 |
| Home team on a back-to-back, visitor rested | 1,276 | 49.8% | −0.2 |
| Visitor on a back-to-back, home team rested | 2,731 | 62.1% | +4.1 |
| Both teams on a back-to-back | 841 | 57.4% | +2.4 |
At home, a team on a back-to-back beat a rested visitor 49.8 percent of the time, down from the 56.9 percent home teams won when both sides had rested, and its average margin fell from +2.3 points to −0.2. The second night cancels home-court advantage, which in the NBA is worth about two points a game, as our count of home advantage in six leagues also found.
On the road, the win rate fell from 43.1 percent to 37.9 percent and the average deficit grew from 2.3 points to 4.1. The drop is bigger at home, 7.0 points of win percentage against 5.2 on the road, while the cost in points is close: 2.5 at home and 1.8 on the road.
When both teams were on a back-to-back, the home team won 57.4 percent, about the same as when both had rested. What costs games is being more tired than the opponent. Measured as a rest advantage, a team with one more day off than its opponent won 54.6 percent of the time, and one with two more days off 57.6 percent.
How many back-to-backs are in the NBA schedule
Far fewer than a decade ago. From 2012-13 to 2014-15, teams averaged between 18.7 and 19.3 back-to-backs a season, and in 2012-13 the Brooklyn Nets played 23. Then the league started cutting:
- 2017-18: the season started a week earlier and, by the league's account, had no stretch of four games in five nights for the first time in its history. The average fell to 14.4 back-to-backs per team, from 16.4.
- 2018-19: 13.3 per team, the lowest of the 12 full seasons in our count.
- 2019-20: the league planned 12.4 per team, but the season was halted in March and 171 games were never played, which left 10.5.
- Since then: 15.2 per team in the 72-game 2020-21 season, and between 13.4 and 15.0 in each of the five full seasons after it.
| Season | Back-to-backs per team | Fewest | Most | Four games in five nights |
|---|---|---|---|---|
| 2012-13 | 19.1 | 13 | 23 | 76 |
| 2013-14 | 18.7 | 14 | 22 | 64 |
| 2014-15 | 19.3 | 16 | 22 | 70 |
| 2015-16 | 17.8 | 14 | 20 | 27 |
| 2016-17 | 16.4 | 14 | 19 | 23 |
| 2017-18 | 14.4 | 13 | 16 | 3 |
| 2018-19 | 13.3 | 12 | 15 | 0 |
| 2019-20 (shortened) | 10.5 | 7 | 13 | 0 |
| 2020-21 (72 games) | 15.2 | 13 | 17 | 5 |
| 2021-22 | 14.1 | 11 | 17 | 10 |
| 2022-23 | 13.4 | 12 | 16 | 1 |
| 2023-24 | 14.1 | 13 | 17 | 0 |
| 2024-25 | 15.0 | 13 | 17 | 4 |
| 2025-26 | 14.7 | 13 | 17 | 6 |
| 2026-27 (schedule) | 14.2 | 13 | 16 | 0 |
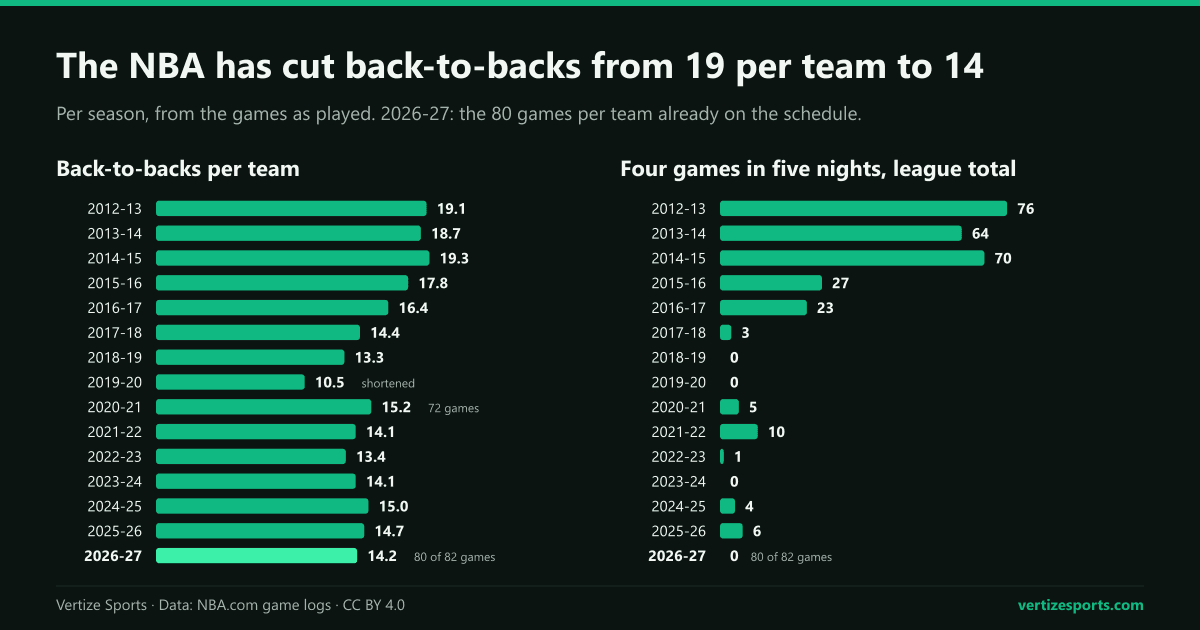
The four-in-five went the same way: 70 in 2014-15 and 23 in 2016-17 by our count, none in 2018-19 or 2023-24. Our count is of games as played, which include games moved after a schedule came out, and since 2017-18 it has never gone above 10 in a season.
Has the back-to-back penalty changed?
Fewer back-to-backs have not made each one cheaper. From 2012-13 to 2016-17, teams on the second night won 43.9 percent of their games; in the seven full seasons since, 44.4 percent. In both periods they were outscored by 2.0 points a game.
The exception is last season. In 2025-26, teams on a back-to-back won 48.3 percent and lost by 1.2 points on average, the smallest penalty of the 12 full seasons. That is one season of 441 games, a small sample, and in the four seasons before it the rate was 43.8 percent.
NBA back-to-backs in the 2026-27 schedule, team by team
The 2026-27 season runs from October 20 to April 11, and the schedule gives every team dates for 80 of its 82 games; the other two, played from December 4 to 10, depend on the results of NBA Cup group play. On those 80 games we count 426 back-to-backs, 14.2 per team, the figure in the league's schedule notes, with no team above 16 and no four games in five nights. The league's August figure for 2025-26 was 14.4; on the games as played, including the two added in December, that season finished at 14.7.
| Back-to-backs | Teams |
|---|---|
| 16 | Boston Celtics, Brooklyn Nets, Cleveland Cavaliers, Dallas Mavericks, New Orleans Pelicans |
| 15 | Chicago Bulls, Detroit Pistons, Golden State Warriors, Indiana Pacers, Los Angeles Lakers, Portland Trail Blazers, Toronto Raptors |
| 14 | Atlanta Hawks, Denver Nuggets, Houston Rockets, Milwaukee Bucks, Orlando Magic, Sacramento Kings, Washington Wizards |
| 13 | Charlotte Hornets, LA Clippers, Memphis Grizzlies, Miami Heat, Minnesota Timberwolves, New York Knicks, Oklahoma City Thunder, Philadelphia 76ers, Phoenix Suns, San Antonio Spurs, Utah Jazz |
The champion New York Knicks and the teams with last season's two best records, the Oklahoma City Thunder (64-18) and the San Antonio Spurs (62-20), are among the 11 teams with 13, the fewest, while Boston, Brooklyn, Cleveland, Dallas and New Orleans have the most, 16.
The spread matters less than it looks. Three back-to-backs separate the most from the fewest, and at the five to seven points of win percentage that a second night costs, three of them are worth about a fifth of a win over a season. For where each team is expected to finish, see our projected wins for every NBA team in 2026-27.
The league also keeps teams fresh for its showcase dates: no team plays the day before its NBA Cup group games, on Cup Nights from October 30 to November 27, and the same rule covers Christmas and several national TV windows. The notes also count 59 back-to-backs with 750 miles or more of travel, down from 74 last season.
Every game is on the NBA schedule, night by night, and the NBA simulator lets you play out the season yourself, game by game or all at once.
NBA back-to-backs and rest days: frequently asked questions
What is the NBA record on the second night of a back-to-back? Teams on the second night won 44.2 percent of their games from 2012-13 to 2025-26, leaving out the two shortened seasons, and were outscored by 2.0 points a game. Against an opponent with at least a day of rest, they won 41.7 percent.
How many back-to-backs does each NBA team play? About 14. The 2026-27 schedule has 14.2 per team over the 80 games already dated, from 13 to 16. In 2014-15 the average was 19.3.
How many days of rest do NBA teams get between games? Usually one. In 2025-26, 62.6 percent of games came after one day off, 18.1 percent on the second night of a back-to-back and 19.2 percent after two days or more.
Does the NBA still schedule four games in five nights? No. The league says 2017-18 was the first season in its history without one, and the 2026-27 schedule has none. By our count there were 70 in 2014-15.
Is a back-to-back worse at home or on the road? Road teams on a back-to-back win less often, 37.9 percent against a rested home team, but the drop from their usual rate is bigger at home: 7.0 points of win percentage, against 5.2 on the road.
How this was built: every regular-season game from 2012-13 to 2025-26 in NBA.com's official game logs, plus the NBA Cup finals, which were played but do not count in the standings. Days of rest are the days since the team's previous game, minus one. First games of a season are left out of the results, which cover the 12 full seasons; adding 2019-20 and 2020-21 moves each win percentage by less than a point. Home and road are as NBA.com lists them, and the 10 neutral-site games it has marked since 2024-25 are out of the home-and-road splits. Indiana at Boston on April 16, 2013, was canceled and never played. The league's published averages match our back-to-back counts within 0.1 per team in every full season we could check, 2014-15 among them, except 2025-26: 14.4 announced, 14.7 as played. The 2026-27 counts come from the official NBA schedule, retrieved September 29, 2026.