We added up the regular-season batting totals of every AL and NL team in MLB's Stats API, 1,888,959 runs in 213,999 games, and divided by team games played. Runs per game means per team, the usual baseball measure. MLB's records also count the Federal League of 1914-15 and seven Negro Leagues of 1920-48 as major leagues; we leave their teams out so that every season compares the same two leagues.
MLB scoring by year: runs per game decade by decade
The seasons from 1901 to 1909 averaged 3.92 runs a game and the 1910s 3.91, the lowest of any decade. The 1930s were the highest, at 4.93, ahead of the 1920s at 4.81 and the 2000s at 4.76. The seven seasons of the 2020s so far average 4.47, close to the all-time 4.41.
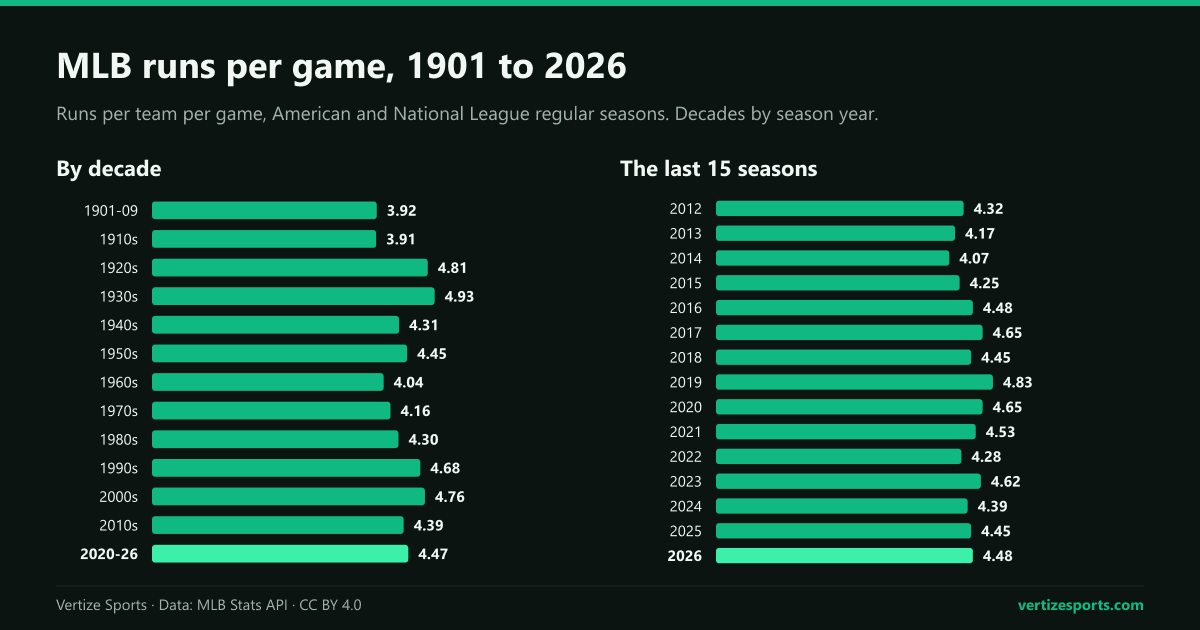
In the last 15 seasons, scoring bottomed out at 4.07 in 2014 and peaked at 4.83 in 2019. No season since 1981 has averaged fewer than four runs a game; 13 of the 19 seasons from 1901 to 1919 did.
Dead-ball era runs per game, and the jump of the 1920s
From 1901 to 1919, teams scored 3.92 runs a game and hit 0.15 home runs, about one every seven games. MLB.com dates the end of the Deadball Era to Opening Day 1920, a season of better-made, cleaner baseballs, of spitballs and scuffing being phased out, and of 54 home runs by Babe Ruth in his first year with the New York Yankees. Scoring rose from 3.87 runs a game in 1919 to 4.36 in 1920 and 4.86 in 1921, and home runs per game nearly doubled, from 0.20 to 0.38.
The highest-scoring MLB seasons
Seven seasons reached five runs a game, four from 1925 to 1936 and three from 1996 to 2000. The top five:
- 1930: 5.55, when the National League batted .303 as a whole and scored 5.68 runs a game.
- 1936: 5.19, with the American League at 5.67, its highest.
- 1929: 5.19.
- 2000: 5.14, the highest since 1936.
- 1925: 5.13.
The 2000 season also set a home run mark, 1.17 per team per game, that stood until 2017. The record now belongs to 2019: 1.39 a game, 6,776 home runs in all.
The lowest-scoring MLB seasons and the Year of the Pitcher
Four of the five lowest-scoring seasons came before 1920: 1908 at 3.38, 1907 at 3.52, 1909 at 3.54 and 1916 at 3.56. The other is 1968, at 3.42, the lowest since 1908 and the season MLB.com's glossary calls the Year of the Pitcher.
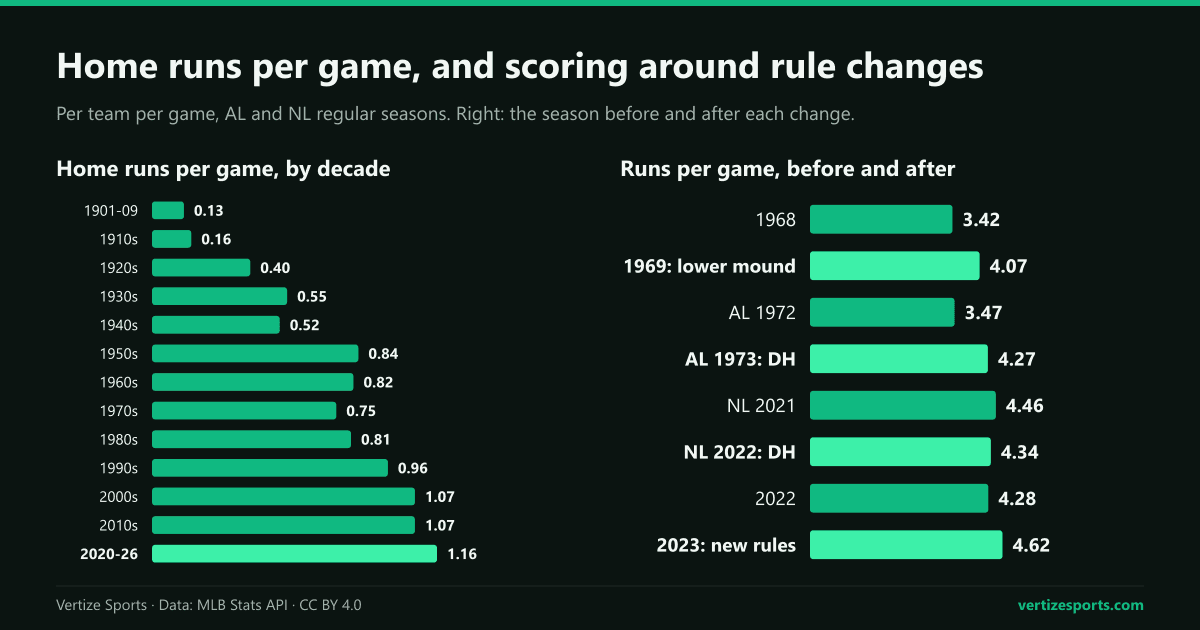
The slide began in 1963, when the strike zone grew from the armpits and the top of the knees to the top of the shoulders and the knees. Scoring fell from 4.46 runs a game in 1962 to 3.95, and 1963 to 1968 averaged 3.86. For 1969 the smaller zone returned and the mound was lowered from 15 inches to 10. Scoring rose to 4.07, the second-biggest one-season rise since 1901, though 1969 also brought four expansion teams: the Kansas City Royals, Seattle Pilots, Montreal Expos and San Diego Padres.
How the designated hitter changed scoring in each league
The American League adopted the designated hitter in 1973; the National League kept pitchers batting until 2022, except in 2020. In the 12 seasons before, NL teams averaged 0.08 more runs a game than AL teams. In 1973 the AL jumped from 3.47 runs a game to 4.27, while the NL went from 3.91 to 4.15.
| Seasons | AL | NL | AL minus NL |
|---|---|---|---|
| 1901-1960 | 4.48 | 4.32 | +0.16 |
| 1961-1972 | 3.97 | 4.05 | -0.08 |
| 1973-2021, without 2020 | 4.63 | 4.36 | +0.26 |
| 2020 | 4.58 | 4.71 | -0.12 |
| 2022-2026 | 4.36 | 4.52 | -0.16 |
From 1973 to 2021, leaving out 2020, the AL outscored the NL in 47 of 48 seasons, all but 1974. Since the DH became universal in 2022, the NL has scored more in all five seasons, though in 2022, a low-scoring year, its average still slipped, from 4.46 to 4.34, while the AL's fell from 4.60 to 4.22.
MLB scoring from the 2000 peak to the 2014 low
Every season from 1999 to 2009 averaged at least 4.59 runs a game. Scoring then fell to 4.38 in 2010 and 4.07 in 2014, the lowest since 1981. Strikeouts rose in 14 straight seasons, from 6.30 per team per game in 2005 to 8.81 in 2019. The climb back came with the home run: from 2014 to 2019, runs rose from 4.07 to 4.83 a game and home runs from 0.86 to 1.39.
What the 2023 rule changes did to MLB scoring
Scoring fell to 4.28 in 2022, the lowest since 2015, and three rule changes arrived in 2023:
- A pitch timer, or pitch clock: 15 seconds between pitches with the bases empty and 20 with runners on, and a limit of two pickoff attempts or step-offs per plate appearance.
- Shift limits: at least four players on the infield, two of them on each side of second base, which MLB said was intended to increase batting average on balls in play.
- Bigger bases: 18 inches square instead of 15, cutting 4.5 inches from first to second and from second to third.
Runs rose from 4.28 to 4.62 a game, up 8 percent. Steals went from 0.51 to 0.72 a game per team, with attempts by both teams up from 1.4 a game to 1.8, as MLB.com also counted. Batting average on balls in play rose from .290 to .297, and home runs from 1.07 to 1.21 a game.
Part of the gain faded. Scoring settled at 4.39 in 2024, 4.45 in 2025 and 4.48 in 2026, and batting average on balls in play went back to .291 in 2024 and 2025 and .290 in 2026. Steals held up better, at 0.68 to 0.74 a game.
MLB runs per game in 2026
The 2026 regular season ended on Sunday, September 27. Teams scored 21,769 runs in 2,429 games, 4.48 a game, up from 4.45 in 2025 and the most since 2023; that ranks 55th of the 126 seasons since 1901. Home runs came at 1.15 a game.
The National League scored 4.61 runs a game and the American League 4.35, the NL's widest edge since 1972, the last season before the DH. The Chicago Cubs led the majors with 850 runs, 5.25 a game, ahead of the Milwaukee Brewers (5.14) and the Washington Nationals (5.07); the Toronto Blue Jays scored the fewest, 648, or 4.00 a game.
Every 2026 result is on the MLB schedule, the postseason on the 2026 MLB playoff bracket, and each club's final record in the MLB season simulator. For how runs turn into wins, see our run differential analysis; for hockey, NHL goals per game by season.
MLB runs per game by season: the full table
| Season | Runs per game | Home runs per game |
|---|---|---|
| 2026 | 4.48 | 1.15 |
| 2025 | 4.45 | 1.16 |
| 2024 | 4.39 | 1.12 |
| 2023 | 4.62 | 1.21 |
| 2022 | 4.28 | 1.07 |
| 2021 | 4.53 | 1.22 |
| 2020 | 4.65 | 1.28 |
| 2019 | 4.83 | 1.39 |
| 2018 | 4.45 | 1.15 |
| 2017 | 4.65 | 1.26 |
| 2016 | 4.48 | 1.16 |
| 2015 | 4.25 | 1.01 |
| 2014 | 4.07 | 0.86 |
| 2013 | 4.17 | 0.96 |
| 2012 | 4.32 | 1.02 |
| 2011 | 4.28 | 0.94 |
| 2010 | 4.38 | 0.95 |
| 2009 | 4.61 | 1.04 |
| 2008 | 4.65 | 1.00 |
| 2007 | 4.80 | 1.02 |
| 2006 | 4.86 | 1.11 |
| 2005 | 4.59 | 1.03 |
| 2004 | 4.81 | 1.12 |
| 2003 | 4.73 | 1.07 |
| 2002 | 4.62 | 1.04 |
| 2001 | 4.78 | 1.12 |
| 2000 | 5.14 | 1.17 |
| 1999 | 5.08 | 1.14 |
| 1998 | 4.79 | 1.04 |
| 1997 | 4.77 | 1.02 |
| 1996 | 5.04 | 1.09 |
| 1995 | 4.85 | 1.01 |
| 1994 | 4.92 | 1.03 |
| 1993 | 4.60 | 0.89 |
| 1992 | 4.12 | 0.72 |
| 1991 | 4.31 | 0.80 |
| 1990 | 4.26 | 0.79 |
| 1989 | 4.13 | 0.73 |
| 1988 | 4.14 | 0.76 |
| 1987 | 4.72 | 1.06 |
| 1986 | 4.41 | 0.91 |
| 1985 | 4.33 | 0.86 |
| 1984 | 4.26 | 0.77 |
| 1983 | 4.31 | 0.78 |
| 1982 | 4.30 | 0.80 |
| 1981 | 4.00 | 0.64 |
| 1980 | 4.29 | 0.73 |
| 1979 | 4.46 | 0.82 |
| 1978 | 4.10 | 0.70 |
| 1977 | 4.47 | 0.87 |
| 1976 | 3.99 | 0.58 |
| 1975 | 4.21 | 0.70 |
| 1974 | 4.12 | 0.68 |
| 1973 | 4.21 | 0.80 |
| 1972 | 3.69 | 0.68 |
| 1971 | 3.89 | 0.74 |
| 1970 | 4.34 | 0.88 |
| 1969 | 4.07 | 0.80 |
| 1968 | 3.42 | 0.61 |
| 1967 | 3.77 | 0.71 |
| 1966 | 3.99 | 0.85 |
| 1965 | 3.99 | 0.83 |
| 1964 | 4.04 | 0.85 |
| 1963 | 3.95 | 0.84 |
| 1962 | 4.46 | 0.93 |
| 1961 | 4.53 | 0.95 |
| 1960 | 4.31 | 0.86 |
| 1959 | 4.38 | 0.91 |
| 1958 | 4.28 | 0.91 |
| 1957 | 4.31 | 0.89 |
| 1956 | 4.45 | 0.93 |
| 1955 | 4.49 | 0.90 |
| 1954 | 4.38 | 0.78 |
| 1953 | 4.61 | 0.84 |
| 1952 | 4.18 | 0.69 |
| 1951 | 4.55 | 0.75 |
| 1950 | 4.85 | 0.84 |
| 1949 | 4.61 | 0.69 |
| 1948 | 4.58 | 0.63 |
| 1947 | 4.36 | 0.63 |
| 1946 | 4.01 | 0.49 |
| 1945 | 4.18 | 0.41 |
| 1944 | 4.17 | 0.42 |
| 1943 | 3.92 | 0.37 |
| 1942 | 4.08 | 0.44 |
| 1941 | 4.49 | 0.53 |
| 1940 | 4.68 | 0.64 |
| 1939 | 4.82 | 0.59 |
| 1938 | 4.89 | 0.60 |
| 1937 | 4.87 | 0.58 |
| 1936 | 5.19 | 0.55 |
| 1935 | 4.90 | 0.54 |
| 1934 | 4.91 | 0.55 |
| 1933 | 4.48 | 0.44 |
| 1932 | 4.91 | 0.55 |
| 1931 | 4.81 | 0.43 |
| 1930 | 5.55 | 0.63 |
| 1929 | 5.19 | 0.55 |
| 1928 | 4.73 | 0.44 |
| 1927 | 4.75 | 0.37 |
| 1926 | 4.64 | 0.35 |
| 1925 | 5.13 | 0.48 |
| 1924 | 4.76 | 0.36 |
| 1923 | 4.82 | 0.40 |
| 1922 | 4.87 | 0.43 |
| 1921 | 4.86 | 0.38 |
| 1920 | 4.36 | 0.26 |
| 1919 | 3.87 | 0.20 |
| 1918 | 3.63 | 0.12 |
| 1917 | 3.59 | 0.13 |
| 1916 | 3.56 | 0.15 |
| 1915 | 3.79 | 0.15 |
| 1914 | 3.74 | 0.17 |
| 1913 | 4.04 | 0.19 |
| 1912 | 4.53 | 0.18 |
| 1911 | 4.51 | 0.21 |
| 1910 | 3.83 | 0.14 |
| 1909 | 3.54 | 0.10 |
| 1908 | 3.38 | 0.11 |
| 1907 | 3.52 | 0.10 |
| 1906 | 3.61 | 0.11 |
| 1905 | 3.89 | 0.14 |
| 1904 | 3.72 | 0.13 |
| 1903 | 4.44 | 0.15 |
| 1902 | 4.42 | 0.16 |
| 1901 | 4.99 | 0.20 |
MLB runs per game: frequently asked questions
What is the average number of runs per game in MLB? In the 2026 regular season it was 4.48 per team, or 8.96 for both teams together. Across every AL and NL season since 1901 it is 4.41.
What was the highest-scoring MLB season? 1930, at 5.55 runs per team per game. The highest since 1936 is 2000, at 5.14.
What was the lowest-scoring MLB season? 1908, at 3.38 runs per team per game. The lowest since then is 1968, at 3.42, and no season since 1981 has averaged under four.
How many runs per game were scored in the dead-ball era? From 1901 to 1919, 3.92 per team per game, with 0.15 home runs.
Did the 2023 rule changes increase scoring? Runs rose from 4.28 a game in 2022 to 4.62 in 2023, the first season under the new rules, then settled between 4.39 and 4.48 from 2024 to 2026.
How this was built: runs, home runs and games are the regular-season batting totals of every AL and NL team in MLB's Stats API for every season from 1901 to 2026; runs per game is runs divided by team games, postseason excluded. Federal League and Negro Leagues teams, which the API lists in 1914-15 and 1920-48, are left out using its final AL and NL standings, which match our runs and games in every season since 1975 and come within 0.012 runs a game before. Decades go by season year. Batting average on balls in play is hits minus home runs, divided by at-bats minus strikeouts, home runs and sacrifice flies. 2026 is the complete regular season, March 25 to September 27.