We added up every regular-season goal in the NHL's team statistics, published on NHL.com, and divided by the games played: 396,490 goals in 65,240 games from 1917-18 to 2025-26. Goals per game here means both teams together, overtime included. The shootout is left out: the NHL gives the winner one goal in the final score and the standings but not in its team goal totals, and counting it would add 0.06 to 0.15 goals a game in each season since 2005-06, when shootouts began.
Average goals per game in the NHL, decade by decade
Counting each season in the decade it started, the league's first three seasons, 1917-18 to 1919-20, averaged 9.40 goals a game. The 1920s and 1930s fell below five, at 4.69 and 4.85, and the 1980s were the highest-scoring full decade, at 7.67. The 2000s and 2010s both came in at about 5.5, 5.52 and 5.54, and the six seasons of the 2020s so far average 6.13, just above the all-time 6.08.
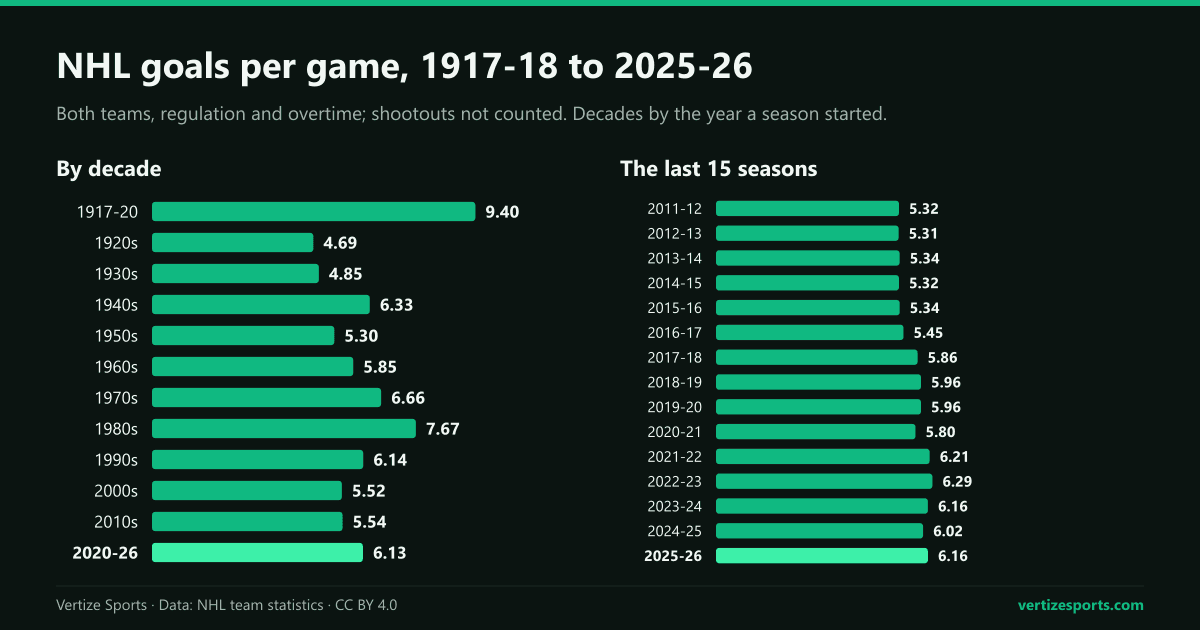
The last 15 seasons show a floor near 5.3 from 2011-12 to 2015-16, a jump to 5.86 in 2017-18 and every season at six or more since 2021-22. For contrast, the 16 soccer leagues we counted for 2025-26 ranged from 2.43 goals a game in Serie A to 3.24 in the Bundesliga.
The highest-scoring NHL seasons
The five highest-scoring seasons all came in the league's first 27 seasons, with schedules of 18 to 50 games per team:
- 1917-18: 10.06 goals a game, the only season above 10, from 342 goals in 34 games.
- 1919-20: 9.58.
- 1920-21: 8.46.
- 1918-19: 8.26.
- 1943-44: 8.17, the first season with a red line at center ice, which the NHL's history of its rule changes treats as the start of its modern era.
No season since has matched 1943-44. The closest was 1981-82, at 8.03, the peak of a run in which every season from 1980-81 to 1985-86 averaged at least 7.69.
The 1917-18 figure counts the 34 games that were played. After fire destroyed the Montreal Arena in January 1918, the Montreal Wanderers withdrew from the league, and the NHL's game log records two of their January games as 1-0 wins for their opponents. The league's official total of 34 games and its goal totals leave both out, and so do we. Counting the two forfeits as games would put 1917-18 at 9.50, or 9.56 with their 1-0 scores, still behind 1919-20.
The lowest-scoring NHL seasons and the dead-puck era
The three lowest-scoring seasons came in a row: 1926-27 at 4.00, 1927-28 at 3.80 and 1928-29, the low point, at 2.92, less than half the all-time average. In 1928-29 forward passes were still banned inside the attacking zone. The league allowed them in all three zones for 1929-30, and by its own account the new rules more than doubled scoring; on December 21, 1929, partway through the season, it added a rule similar to the modern offside. Our count has 1,301 goals in 1929-30, against 642 the season before, in the same 220 games.
The next long slide came much later. From 1992-93 to 2003-04, the stretch a Minnesota Wild retrospective on NHL.com calls the Dead Puck Era and attributes largely to hooking and holding going uncalled, scoring fell from 7.25 to 5.14 goals a game, a drop of more than two goals a game. That 2003-04 figure was the lowest since 1955-56's 5.07, and no season since has gone lower.
What the 2005-06 rule changes did to NHL scoring
A lockout canceled the 2004-05 season, and the league came back with a package of rule changes:
- Two-line passes became legal: the center red line no longer stops them.
- The goal lines moved to 11 feet from the end boards, and the neutral zone shrank from 54 feet to 50.
- Goaltender equipment got smaller, and goalies may not play the puck behind the net outside a trapezoid.
- A team that ices the puck cannot change players before the next faceoff, and tag-up offside returned.
- Games still tied after five minutes of overtime go to a shootout instead of ending in a tie.
The league also recommitted to calling the obstruction rules it already had, as the same Wild retrospective notes, and the numbers show it. Teams had 14,390 power plays in 2005-06, up from 10,427 in 2003-04: 11.70 a game between the two teams, the most of any season since 1977-78, the first for which the NHL lists every team's power-play chances. Scoring jumped from 5.14 to 6.05 goals a game, and power-play goals, up from 1,717 to 2,545, supplied 0.67 of the 0.91 extra goals a game, almost three-quarters.
It did not last. Power plays fell to 8.57 a game by 2007-08 and 6.61 by 2011-12, and scoring went down with them, to 5.32 in 2011-12, only 0.18 above 2003-04.
NHL scoring trends: where the recent rise comes from
Scoring turned up again in 2017-18, to 5.86 from 5.45, and has been at six or more every season since 2021-22. The 2022-23 season reached 6.287, a hair above 1995-96's 6.286 and the highest since 1993-94's 6.48.
The NHL's record of the situation of each goal, which starts in 2009-10, shows where the extra goals came from. The last five seasons averaged 0.81 more goals a game than the five from 2012-13 to 2016-17, and 65 percent of the difference came at five-on-five:
| Goals per game | 2012-13 to 2016-17 | 2021-22 to 2025-26 | Change |
|---|---|---|---|
| Five-on-five | 3.57 | 4.09 | +0.53 |
| Power play | 1.13 | 1.20 | +0.07 |
| Into an empty net | 0.23 | 0.36 | +0.13 |
| Everything else | 0.43 | 0.51 | +0.08 |
| All goals | 5.36 | 6.17 | +0.81 |
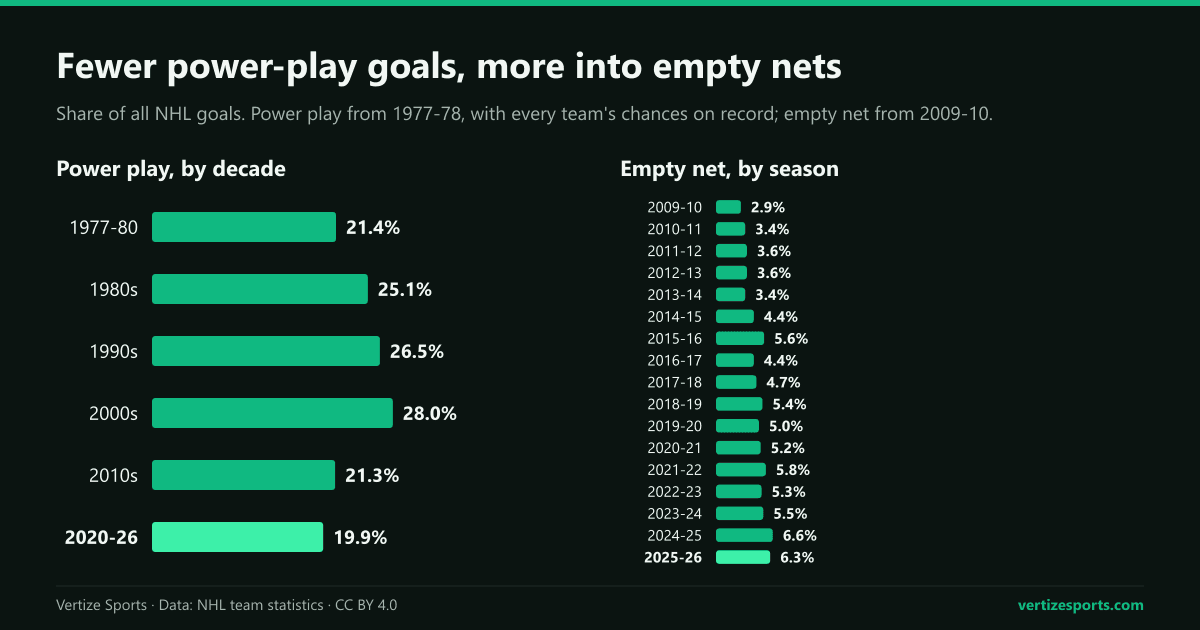
Empty-net goals have more than doubled their share over the 17 seasons of this data, from 2.9 percent of all goals in 2009-10 to 6.6 percent in 2024-25, when there were 524 of them, the most in any of those seasons. In 2025-26 it was 6.3 percent. Goals with an extra attacker on the ice rose too, from 0.11 to 0.15 a game between the two periods. Both fit what former NHL assistant coach Dan Lambert wrote for NHL.com in January 2026: teams pull their goalie earlier than they used to, largely because the analytics favor it.
The power play has gone the other way. There were 5.41 power plays a game in 2024-25, both teams combined, the fewest since 1977-78, and the six lowest power-play shares of scoring since then all came in 2018-19 or later. In 2025-26, 19.7 percent of goals came on the power play, against 34.2 percent in 2005-06.
NHL goals per game in 2025-26 and the start of 2026-27
The 2025-26 regular season produced 8,086 goals in 1,312 games, 6.16 a game: exactly as many goals as 2023-24 in the same number of games, and tied with it for the fourth-highest rate since 1993-94. Its 119 shootouts were the most since 2014-15, and counting their deciding goals would have made it 6.25.
The 2026-27 season opened on September 29 with 84 games scheduled for each team, the first 84-game schedule since 1993-94. The first night produced 27 goals in five games, from the Florida Panthers' 1-0 overtime win at the Carolina Hurricanes to the Vancouver Canucks' 6-5 overtime win at the Edmonton Oilers, far too small a sample to say anything about the season.
The NHL schedule lists every game night by night, with scores once a night is finished. The NHL simulator plays out the rest of the season from the real standings with finished games locked, overtime and the point for an overtime loss included.
NHL goals per game by season: the full table
| Season | Games | Goals | Goals per game |
|---|---|---|---|
| 2025-26 | 1,312 | 8,086 | 6.16 |
| 2024-25 | 1,312 | 7,901 | 6.02 |
| 2023-24 | 1,312 | 8,086 | 6.16 |
| 2022-23 | 1,312 | 8,248 | 6.29 |
| 2021-22 | 1,312 | 8,150 | 6.21 |
| 2020-21 | 868 | 5,031 | 5.80 |
| 2019-20 | 1,082 | 6,448 | 5.96 |
| 2018-19 | 1,271 | 7,577 | 5.96 |
| 2017-18 | 1,271 | 7,449 | 5.86 |
| 2016-17 | 1,230 | 6,704 | 5.45 |
| 2015-16 | 1,230 | 6,565 | 5.34 |
| 2014-15 | 1,230 | 6,549 | 5.32 |
| 2013-14 | 1,230 | 6,573 | 5.34 |
| 2012-13 | 720 | 3,822 | 5.31 |
| 2011-12 | 1,230 | 6,545 | 5.32 |
| 2010-11 | 1,230 | 6,721 | 5.46 |
| 2009-10 | 1,230 | 6,803 | 5.53 |
| 2008-09 | 1,230 | 7,006 | 5.70 |
| 2007-08 | 1,230 | 6,691 | 5.44 |
| 2006-07 | 1,230 | 7,082 | 5.76 |
| 2005-06 | 1,230 | 7,443 | 6.05 |
| 2003-04 | 1,230 | 6,318 | 5.14 |
| 2002-03 | 1,230 | 6,530 | 5.31 |
| 2001-02 | 1,230 | 6,442 | 5.24 |
| 2000-01 | 1,230 | 6,782 | 5.51 |
| 1999-00 | 1,148 | 6,306 | 5.49 |
| 1998-99 | 1,107 | 5,830 | 5.27 |
| 1997-98 | 1,066 | 5,624 | 5.28 |
| 1996-97 | 1,066 | 6,216 | 5.83 |
| 1995-96 | 1,066 | 6,701 | 6.29 |
| 1994-95 | 624 | 3,727 | 5.97 |
| 1993-94 | 1,092 | 7,081 | 6.48 |
| 1992-93 | 1,008 | 7,311 | 7.25 |
| 1991-92 | 880 | 6,123 | 6.96 |
| 1990-91 | 840 | 5,805 | 6.91 |
| 1989-90 | 840 | 6,189 | 7.37 |
| 1988-89 | 840 | 6,286 | 7.48 |
| 1987-88 | 840 | 6,237 | 7.43 |
| 1986-87 | 840 | 6,165 | 7.34 |
| 1985-86 | 840 | 6,667 | 7.94 |
| 1984-85 | 840 | 6,530 | 7.77 |
| 1983-84 | 840 | 6,627 | 7.89 |
| 1982-83 | 840 | 6,493 | 7.73 |
| 1981-82 | 840 | 6,741 | 8.03 |
| 1980-81 | 840 | 6,457 | 7.69 |
| 1979-80 | 840 | 5,902 | 7.03 |
| 1978-79 | 680 | 4,757 | 7.00 |
| 1977-78 | 720 | 4,747 | 6.59 |
| 1976-77 | 720 | 4,783 | 6.64 |
| 1975-76 | 720 | 4,913 | 6.82 |
| 1974-75 | 720 | 4,932 | 6.85 |
| 1973-74 | 624 | 3,989 | 6.39 |
| 1972-73 | 624 | 4,088 | 6.55 |
| 1971-72 | 546 | 3,348 | 6.13 |
| 1970-71 | 546 | 3,409 | 6.24 |
| 1969-70 | 456 | 2,649 | 5.81 |
| 1968-69 | 456 | 2,718 | 5.96 |
| 1967-68 | 444 | 2,476 | 5.58 |
| 1966-67 | 210 | 1,252 | 5.96 |
| 1965-66 | 210 | 1,277 | 6.08 |
| 1964-65 | 210 | 1,208 | 5.75 |
| 1963-64 | 210 | 1,166 | 5.55 |
| 1962-63 | 210 | 1,249 | 5.95 |
| 1961-62 | 210 | 1,264 | 6.02 |
| 1960-61 | 210 | 1,261 | 6.00 |
| 1959-60 | 210 | 1,238 | 5.90 |
| 1958-59 | 210 | 1,217 | 5.80 |
| 1957-58 | 210 | 1,175 | 5.60 |
| 1956-57 | 210 | 1,130 | 5.38 |
| 1955-56 | 210 | 1,064 | 5.07 |
| 1954-55 | 210 | 1,059 | 5.04 |
| 1953-54 | 210 | 1,009 | 4.80 |
| 1952-53 | 210 | 1,006 | 4.79 |
| 1951-52 | 210 | 1,090 | 5.19 |
| 1950-51 | 210 | 1,139 | 5.42 |
| 1949-50 | 210 | 1,148 | 5.47 |
| 1948-49 | 180 | 978 | 5.43 |
| 1947-48 | 180 | 1,054 | 5.86 |
| 1946-47 | 180 | 1,138 | 6.32 |
| 1945-46 | 150 | 1,003 | 6.69 |
| 1944-45 | 150 | 1,103 | 7.35 |
| 1943-44 | 150 | 1,225 | 8.17 |
| 1942-43 | 150 | 1,083 | 7.22 |
| 1941-42 | 168 | 1,047 | 6.23 |
| 1940-41 | 168 | 900 | 5.36 |
| 1939-40 | 168 | 838 | 4.99 |
| 1938-39 | 168 | 851 | 5.07 |
| 1937-38 | 192 | 972 | 5.06 |
| 1936-37 | 192 | 946 | 4.93 |
| 1935-36 | 192 | 831 | 4.33 |
| 1934-35 | 216 | 1,087 | 5.03 |
| 1933-34 | 216 | 1,041 | 4.82 |
| 1932-33 | 216 | 983 | 4.55 |
| 1931-32 | 192 | 957 | 4.98 |
| 1930-31 | 220 | 1,054 | 4.79 |
| 1929-30 | 220 | 1,301 | 5.91 |
| 1928-29 | 220 | 642 | 2.92 |
| 1927-28 | 220 | 836 | 3.80 |
| 1926-27 | 220 | 879 | 4.00 |
| 1925-26 | 126 | 581 | 4.61 |
| 1924-25 | 90 | 450 | 5.00 |
| 1923-24 | 48 | 255 | 5.31 |
| 1922-23 | 48 | 313 | 6.52 |
| 1921-22 | 48 | 380 | 7.92 |
| 1920-21 | 48 | 406 | 8.46 |
| 1919-20 | 48 | 460 | 9.58 |
| 1918-19 | 27 | 223 | 8.26 |
| 1917-18 | 34 | 342 | 10.06 |
NHL goals per game: frequently asked questions
What is the average number of goals per game in the NHL? In 2025-26 it was 6.16, counting both teams in regulation and overtime. Across every season since 1917-18 it is 6.08.
What was the highest-scoring NHL season? 1917-18, the league's first, at 10.06 goals a game. The highest since 1943-44, the first season with a red line at center ice and 8.17 goals a game, is 1981-82 at 8.03.
What was the lowest-scoring NHL season? 1928-29, at 2.92 goals a game, the last season before forward passes were allowed inside the attacking zone. The lowest since 1955-56 is 2003-04, at 5.14.
Do shootout goals count in NHL goals per game? Not in these figures. The NHL credits the shootout winner with one goal in the final score and the standings, but not in its team goal totals. Counting it would add 0.06 to 0.15 goals a game in each season since 2005-06.
Where did the recent rise in NHL scoring come from? Mostly five-on-five play, which supplied 0.53 of the 0.81 extra goals a game in the last five seasons compared with 2012-13 to 2016-17. Empty-net goals added 0.13, and the power play 0.07.
How this was built: goals are the NHL's regular-season team totals for every season from 1917-18 to 2025-26, from the league's stats API (the data behind NHL Stats), summed across teams. They count goals in regulation and overtime but not the goal credited for winning a shootout, and are divided by the number of games the NHL lists for each season. Every season's total was checked against the league's game-by-game results, and they match once the two unplayed 1917-18 games and the shootout goals are taken out. Power-play goals and chances come from the same source's power-play report, from 1977-78, the first season for which it lists every team's chances; goals by situation, including empty-net goals, from its goals-by-strength report, which starts in 2009-10. The 2026-27 figures are the five games of September 29, 2026.