We took every regular-season game since 1996-97 from NBA.com's official team game logs, 35,546 in all, and built each team's record in close games: those decided by three points or fewer, as in our study of NBA blowouts, with five or fewer as a wider cut. Overtime games count by their final margin.
Is clutch real in the NBA? Close-game records from one season to the next
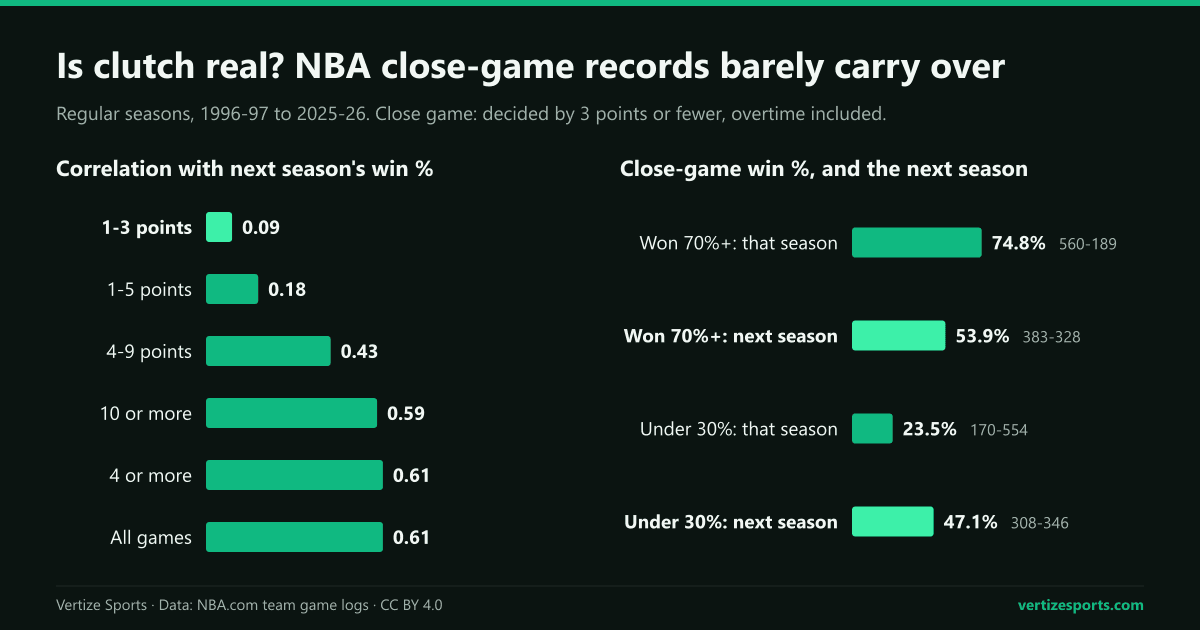
Not at the team level. Across 861 pairs of consecutive seasons by the same franchise, a team's winning percentage in games decided by three or fewer correlates at 0.09 with the next season's, where 0 means no relationship and 1 a perfect one. The more lopsided the game, the more its result says about the teams:
| Games | Share of games | Correlation with next season |
|---|---|---|
| Decided by 3 points or fewer | 15.3% | 0.09 |
| 3 or fewer, in regulation only | 12.9% | 0.09 |
| 3 or fewer, or any overtime game | 18.9% | 0.10 |
| Decided by 5 points or fewer | 27.3% | 0.18 |
| Decided by 4 to 9 points | 36.4% | 0.43 |
| Decided by 10 points or more | 48.3% | 0.59 |
| Decided by 4 points or more | 84.7% | 0.61 |
| All games | 100% | 0.61 |
Counting overtime games another way changes nothing, as the second and third rows show. Overtime records alone correlate at 0.06 from one season to the next, and the team with the better point differential wins only 54.4 percent of regulation games decided by three or fewer, against 68.0 percent of all regulation games, as our study of NBA overtime games found.
The NBA matches the other leagues we have measured. In baseball, one-run records correlate at 0.03 from one season to the next, against 0.57 in other games, and in football, records in one-score games correlate at 0.08, against 0.36 in games decided by nine points or more.
How many NBA games are decided by 3 points or fewer
About 15 percent. Of the 35,546 regular-season games since 1996-97, 5,442 were decided by three points or fewer, 15.3 percent, and 9,711 by five or fewer, 27.3 percent. The three-point share has stayed between 13.6 percent (2021-22) and 18.2 percent (2004-05), while the five-point share fell to 25.1 percent over the last five seasons as margins widened.
| Seasons | Decided by 3 or fewer | Decided by 5 or fewer | Went to overtime |
|---|---|---|---|
| 1996-97 to 2000-01 | 15.4% | 28.0% | 6.2% |
| 2001-02 to 2005-06 | 17.0% | 29.0% | 6.5% |
| 2006-07 to 2010-11 | 14.9% | 27.6% | 6.1% |
| 2011-12 to 2015-16 | 15.1% | 27.3% | 6.3% |
| 2016-17 to 2020-21 | 15.1% | 27.1% | 5.5% |
| 2021-22 to 2025-26 | 14.5% | 25.1% | 5.0% |
| All 30 seasons | 15.3% | 27.3% | 5.9% |
Overtime games count when they end close: 845 of the 2,113 that went to overtime finished within three points, 15.5 percent of all close games. In 2025-26, 177 games were decided by three or fewer, 14.4 percent, and the five-point share, 24.5 percent, was the second-lowest of the 30 seasons.
Point differential and close-game win percentage
Better teams do win more close games, but not many more. A team's point differential per game correlates at 0.97 with its winning percentage in games decided by four or more and at 0.26 with its percentage in games decided by three or fewer. Each point of differential adds 3.5 percentage points of winning percentage in the first group and 0.9 in close games:
| Point differential per game | Team-seasons | Record, 3 points or fewer | Win % | Win % in other games |
|---|---|---|---|---|
| -6.0 or worse | 120 | 531-737 | 41.9% | 22.6% |
| -5.9 to -3.0 | 117 | 671-830 | 44.7% | 33.2% |
| -2.9 to 0.0 | 189 | 1,239-1,206 | 50.7% | 45.1% |
| +0.1 to +2.9 | 220 | 1,455-1,374 | 51.4% | 56.1% |
| +3.0 to +5.9 | 157 | 1,016-886 | 53.4% | 66.0% |
| +6.0 or better | 89 | 530-409 | 56.4% | 76.0% |
With about 12 close games a season, coin flips alone would spread teams' close-game records by 15.1 percentage points; the real spread is 15.9, so chance accounts for about 90 percent of the variance. The part of a close-game record that point differential does not explain, the part a clutch team would carry, correlates at 0.03 from one season to the next. Last season's point differential predicts a team's close-game record better than last season's close-game record does: 0.18 against 0.09.
Teams that win close games regress the next season
Records far from .500 in close games drift back toward it, while the rest of a team's record holds. Among the 657 team-seasons with at least 10 close games and a following season:
- The 60 teams that won 70 percent or more of their close games went 560-189 in them, 74.8 percent, and 383-328 the next season, 53.9 percent. Their winning percentage in other games barely moved, from 57.5 to 57.0, so their overall percentage fell from 60.2 to 56.5, and 34 of the 60 had a worse record.
- The 54 teams under 30 percent went 170-554, 23.5 percent, then 308-346, 47.1 percent. Their other games held at 41.0 and 40.9 percent, and 35 of the 54 improved.
Best and worst NBA records in close games since 1996-97
| Season | Team | Record, 3 points or fewer | Overall | Point diff. per game | Next season, 3 or fewer |
|---|---|---|---|---|---|
| 1996-97 | Miami Heat | 15-4 | 61-21 | +5.5 | 9-4 |
| 2018-19 | Denver Nuggets | 13-3 | 54-28 | +4.0 | 9-5 |
| 2002-03 | Sacramento Kings | 11-2 | 59-23 | +6.5 | 5-4 |
| 2017-18 | Indiana Pacers | 11-2 | 48-34 | +1.4 | 6-6 |
| 2006-07 | Dallas Mavericks | 12-3 | 67-15 | +7.2 | 5-6 |
| 2008-09 | Sacramento Kings | 2-14 | 17-65 | -8.8 | 6-7 |
| 2021-22 | Indiana Pacers | 3-14 | 25-57 | -3.5 | 8-7 |
| 2004-05 | Charlotte Bobcats | 5-16 | 18-64 | -6.0 | 5-7 |
| 2016-17 | Charlotte Hornets | 0-9 | 36-46 | +0.2 | 1-5 |
| 1997-98 | Denver Nuggets | 1-10 | 11-71 | -11.8 | 5-0 |
The 1996-97 Miami Heat finished the most games above .500 in close games, and the 1999-00 Philadelphia 76ers won the most, 17, against eight losses. The 2016-17 Charlotte Hornets went 0-9, the most close games any team has played in a season without winning one, while the 2013-14 San Antonio Spurs went 7-0. The 2019-20 Dallas Mavericks went 2-11 in them despite outscoring opponents by 4.9 points a game.
Close games and the Pythagorean record: how luck shows in the standings
The Pythagorean record turns points scored and allowed into an expected winning percentage. Daryl Morey's exponent of 13.91 fits our 30 seasons almost exactly, with a best fit of 13.93, and misses a typical team's record by 3.0 wins over 82 games, against 3.5 for John Hollinger's 16.5.
Close games are where teams beat or miss that record. The gap between actual and expected wins, with an exponent of 14, correlates at 0.55 with a team's close-game wins above .500, and at 0.63 counting games decided by five or fewer. The 29 team-seasons that finished five or more wins above their expected record went 224-111 in close games, 66.9 percent, against 54.1 percent in other games; the 43 that finished five or more below went 161-348, 31.6 percent.
The gap does not last. It correlates at 0.11 from one season to the next, and the 27 teams five or more wins above their expected record that played another season went from 6.2 wins above it to 0.8. The largest gap belongs to the 2022-23 Milwaukee Bucks, 58-24 with the differential of a 50-win team.
The luckiest and unluckiest NBA teams of 2025-26
The Los Angeles Lakers finished 53-29 with a point differential of +1.8 per game, the profile of a 45-win team; their 7.7 wins above expectation were the third-most in 30 seasons. They went 8-3 in games decided by three or fewer and 25-8 in single-digit games, while losing 11 games by 20 or more.
The Charlotte Hornets went the other way: 44-38 with a +4.8 differential, 8.9 wins below their expected 52.9, the biggest shortfall in the 30 seasons, just ahead of the 1997-98 Detroit Pistons at 8.8. They went 3-6 in close games and 12-19 in single-digit games, and won 18 games by 20 or more, second only to the Oklahoma City Thunder's 25.
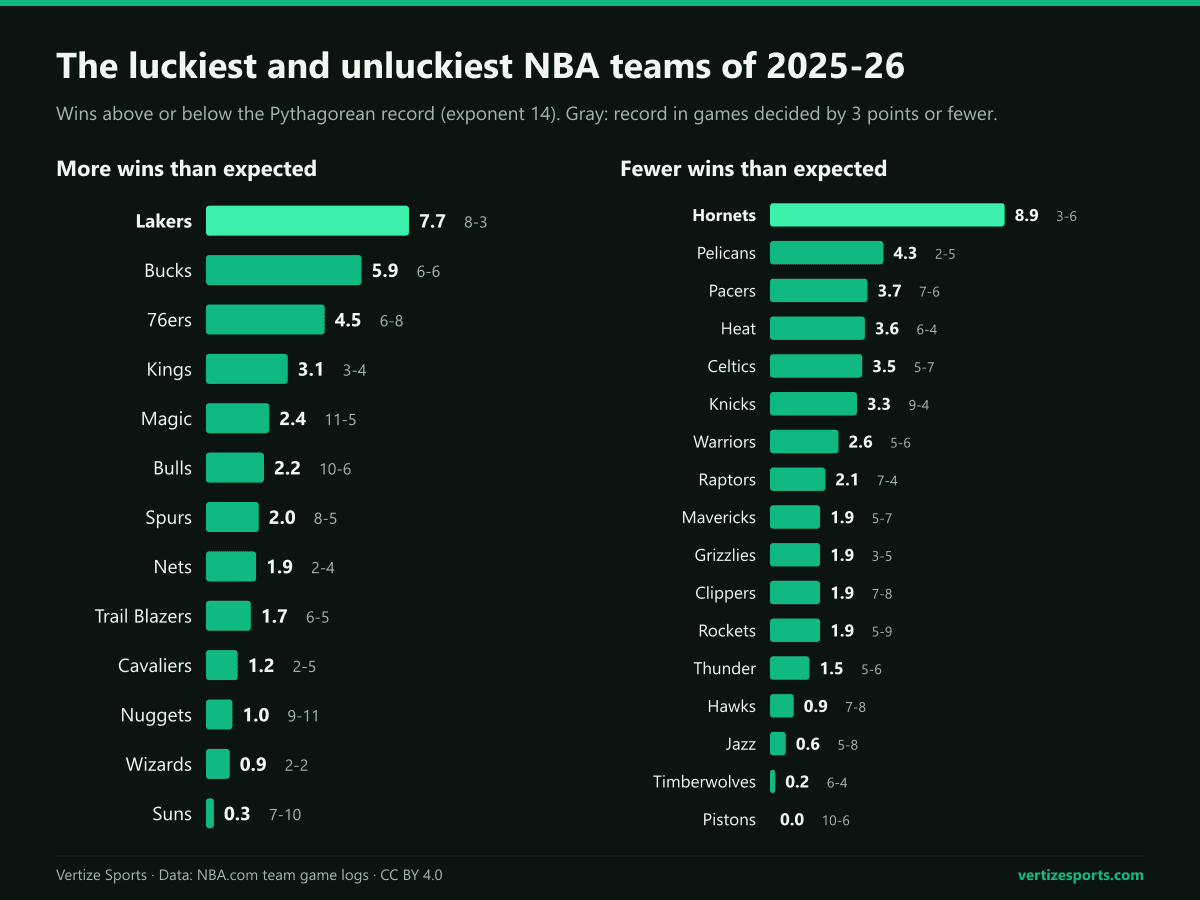
Not every gap is close-game luck. The Milwaukee Bucks finished 5.9 wins above their expected record at 32-50 while going 6-6 in close games; 20 of their 50 losses came by 20 points or more. Eleven teams had a winning record in close games; the Orlando Magic won the most, going 11-5, and the champion New York Knicks went 9-4.
The NBA's own clutch statistics use a different cut, games within five points in the final five minutes of the fourth quarter or overtime. Oklahoma City went 20-7 in the clutch games Shai Gilgeous-Alexander played on the way to his 2025-26 Clutch Player of the Year award; in games decided by three or fewer, the Thunder went 5-6.
The 2026-27 regular season began on Tuesday, October 20, and ends on Sunday, April 11, 2027. Through Nov. 2, 8 of the 107 games played had been decided by three points or fewer, 7.5 percent, against about 15 percent from 1996-97 to 2025-26; three were decided by one point. Every game is on the 2026-27 NBA schedule, and the Vertize NBA simulator rates teams on last season's point differential, not on their records.
NBA close games: frequently asked questions
Is clutch real in the NBA? Not at the team level. A team's winning percentage in games decided by three points or fewer correlates at 0.09 with the next season's, against 0.61 in other games.
How many NBA games are decided by 3 points or fewer? About 15 percent: 5,442 of the 35,546 regular-season games from 1996-97 to 2025-26. Games decided by five or fewer make up 27.3 percent.
What is the best record in close games in an NBA season? Since 1996-97, the most games above .500 is the 1996-97 Miami Heat's 15-4 in games decided by three or fewer; the 2013-14 San Antonio Spurs went 7-0.
Which NBA team was luckiest in 2025-26? The Los Angeles Lakers, 7.7 wins above their Pythagorean record at 53-29. The Charlotte Hornets were the unluckiest, 8.9 wins below theirs.
How this was built: every NBA regular-season game from 1996-97 to 2025-26 (35,546 games; the canceled Indiana-Boston game of April 16, 2013, is left out) from NBA.com's official team game logs. The margin is the final score, overtime included. Team records match NBA.com's final standings for all 892 team-seasons, and close-game records match its splits for 774 of the 776 listed since 2000-01. Year-to-year figures pair consecutive seasons of the same franchise, shortened seasons included. Expected wins use the Pythagorean formula with an exponent of 14. Clutch figures and 2026-27 dates come from NBA Communications, as of October 15, 2026.