We counted every regular-season game since 2000 in MLB's Stats API, with its final score and line score, and checked the totals against the API's final standings: every team's wins, losses, runs and one-run record match in all 810 team-seasons.
How many MLB games are decided by one run
One run is the most common margin, and each larger margin is rarer than the one before it: two runs decided 18.1 percent of games and three runs 14.3 percent.
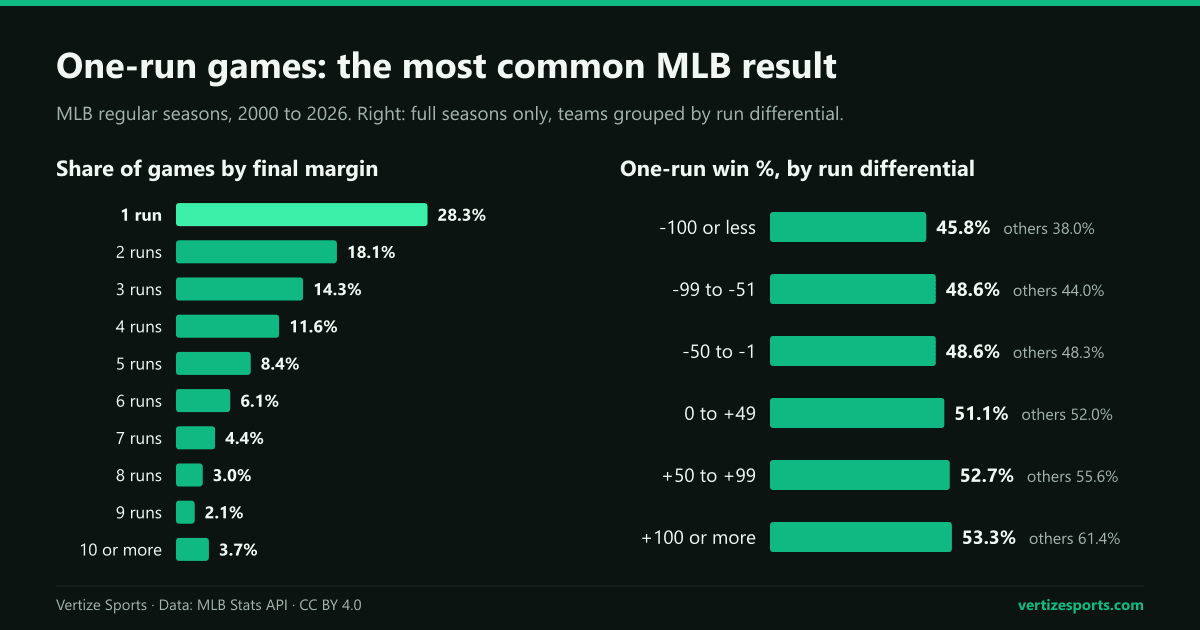
The share moves with scoring. It peaked at 31.0 percent in 2011 and 2013 and 30.5 percent in 2014, the lowest-scoring stretch of the period, when teams averaged as little as 4.07 runs a game, the lowest since 1981. The low was 26.2 percent in 2003. Across the 26 full seasons, the correlation between runs per game and the one-run share is -0.65: fewer runs, more close games. By decade, 27.6 percent of games were decided by one run in 2000-2009 and 28.9 percent in 2010-2019.
Extra innings, walk-offs and the home team in one-run games
Late innings produce many of these games. Of the 18,082 one-run games with a line score, 21.6 percent went to extra innings and 27.3 percent ended on a walk-off. Of the 5,489 extra-inning games, 71.3 percent were decided by one run, and 88.0 percent of the 5,602 walk-offs were one-run wins; none was by more than four, the most a grand slam can add.
That is also why home teams win more one-run games. A game ends the moment the home team takes the lead in the ninth inning or later, so its late wins are usually by one run, while a road team can keep adding runs in the top half. Home teams won 60.7 percent of one-run games and 51.0 percent of games decided by two runs or more.
The automatic runner on second base, used in regular-season extra innings since 2020 and made permanent in 2023, changed those games. Before 2020, 72.1 percent of extra-inning games were decided by one run and 15.8 percent went to the 13th inning or later; since then the figures are 68.8 and 2.3 percent. Home teams, who won 52.4 percent of extra-inning games before the rule, have won 49.5 percent since. The longest game in the data is the Colorado Rockies' 2-1 win in 22 innings at San Diego on April 17, 2008.
Are one-run games luck? What a one-run record says about a team
Mostly luck. Across the 780 full team-seasons since 2000, a team's run differential per game correlates at 0.96 with its winning percentage in games decided by two runs or more, and at 0.34 with its winning percentage in one-run games. The best teams win their one-run games only a little more often than the worst:
| Run differential | Team-seasons | One-run record | One-run win % | Win % in other games |
|---|---|---|---|---|
| -100 or worse | 162 | 3310-3918 | 45.8% | 38.0% |
| -99 to -51 | 106 | 2435-2580 | 48.6% | 44.0% |
| -50 to -1 | 114 | 2597-2747 | 48.6% | 48.3% |
| 0 to +49 | 101 | 2418-2317 | 51.1% | 52.0% |
| +50 to +99 | 142 | 3431-3082 | 52.7% | 55.6% |
| +100 or better | 155 | 3661-3208 | 53.3% | 61.4% |
Teams that outscored their opponents by 100 runs or more won 61.4 percent of their other games but 53.3 percent of their one-run games; teams outscored by 100 or more won 38.0 and 45.8 percent. With about 46 one-run games a season, coin flips alone would spread the records by 7.4 percentage points. The real spread is 8.2, so chance accounts for about 81 percent of the variance.
That is how one-run games pull records away from runs. In our study of run differential, 10.2 runs of differential make one win; a team that goes 30-15 in one-run games instead of 22-23 gains eight wins, worth about 82 runs on that scale.
Do one-run records carry over to the next season?
Barely, as in the NFL's one-score games. Across 720 pairs of consecutive full seasons for the same franchise, one-run winning percentage correlates at 0.03 from one year to the next, against 0.57 for games decided by two runs or more and 0.55 for overall winning percentage.
- The 85 teams that won 60 percent or more of their one-run games went a combined .634 in them, then .495 the next season; they averaged 90.9 wins and then 84.1, and 62 of the 85 had a worse record.
- The 92 teams at 40 percent or below went .362, then .493; they averaged 69.9 wins and then 76.2, and 65 improved.
The two best one-run records since 2000 show the pattern. The 2016 Texas Rangers went 36-11 in them and 95-67 overall with a run differential of +8, then 13-24 and 78-84 in 2017. The 2012 Baltimore Orioles went 29-9, with a 16-2 record in extra innings, and 93-69 at +7, then 20-31 in one-run games and 85-77. In the other direction, the 2023 San Diego Padres went 9-23 in one-run games and 82-80 despite a +104 differential, then 22-19 and 93-69, back in the playoffs.
Best and worst one-run records in a season since 2000
| Season | Team | One-run record | Pct. | Overall | Run diff. | Next season, one-run |
|---|---|---|---|---|---|---|
| 2016 | Texas Rangers | 36-11 | .766 | 95-67 | +8 | 13-24 |
| 2012 | Baltimore Orioles | 29-9 | .763 | 93-69 | +7 | 20-31 |
| 2019 | San Francisco Giants | 38-16 | .704 | 77-85 | -95 | - |
| 2023 | Miami Marlins | 33-14 | .702 | 84-78 | -57 | 23-20 |
| 2003 | San Francisco Giants | 28-12 | .700 | 100-61 | +117 | 18-25 |
| 2021 | Arizona Diamondbacks | 10-31 | .244 | 52-110 | -214 | 17-29 |
| 2018 | Cincinnati Reds | 10-29 | .256 | 67-95 | -123 | 24-33 |
| 2008 | Atlanta Braves | 11-30 | .268 | 72-90 | -25 | 27-25 |
| 2023 | San Diego Padres | 9-23 | .281 | 82-80 | +104 | 22-19 |
| 2018 | Baltimore Orioles | 12-29 | .293 | 47-115 | -270 | 11-22 |
The 2019 San Francisco Giants won the most one-run games of any team since 2000, 38, against 16 losses, and still finished 77-85, outscored by 95 runs. The 2021 Arizona Diamondbacks had the worst one-run record, 10-31, on the way to 52-110. The 2021 New York Mets played the most one-run games, 66, and went 31-35.
One-run records and postseason success
A good one-run record has been no sign of October success. From 2000 to 2025, 26.3 percent of postseason games were decided by one run, 247 of 939, a little less than in the regular season. Leaving out 2020, in the 214 series between teams with different one-run records, the team with the better one won 100, 46.7 percent; the team with the better run differential per game won 123 of 214, 57.5 percent.
- 15 of the 25 World Series champions of full seasons from 2000 to 2025 had a winning one-run record, nine a losing one, and the 2013 Boston Red Sox went 21-21.
- Those champions won 52.9 percent of their one-run games and 61.0 percent of their other games.
- The 2023 Texas Rangers won the World Series after going 14-22 in one-run games, the worst record in them of any champion since 2000, with a +165 run differential.
Eight of the 10 best one-run records since 2000 belonged to playoff teams, and none reached the World Series. The 2016 Rangers were swept in the Division Series by the Toronto Blue Jays, the 2023 Miami Marlins (33-14) were swept by the Philadelphia Phillies in the Wild Card Series, and the 2012 Orioles won the one-game Wild Card and lost the Division Series to the New York Yankees in five. Of the eight, only the 116-46 Seattle Mariners of 2001 won a best-of-five or longer series.
MLB one-run records in 2026: every team
The 2026 regular season ended on September 27; the MLB schedule has every result. Of the 2,429 games, 668 were decided by one run, 27.5 percent, 20th among the 27 seasons since 2000, and 202 ended on a walk-off.
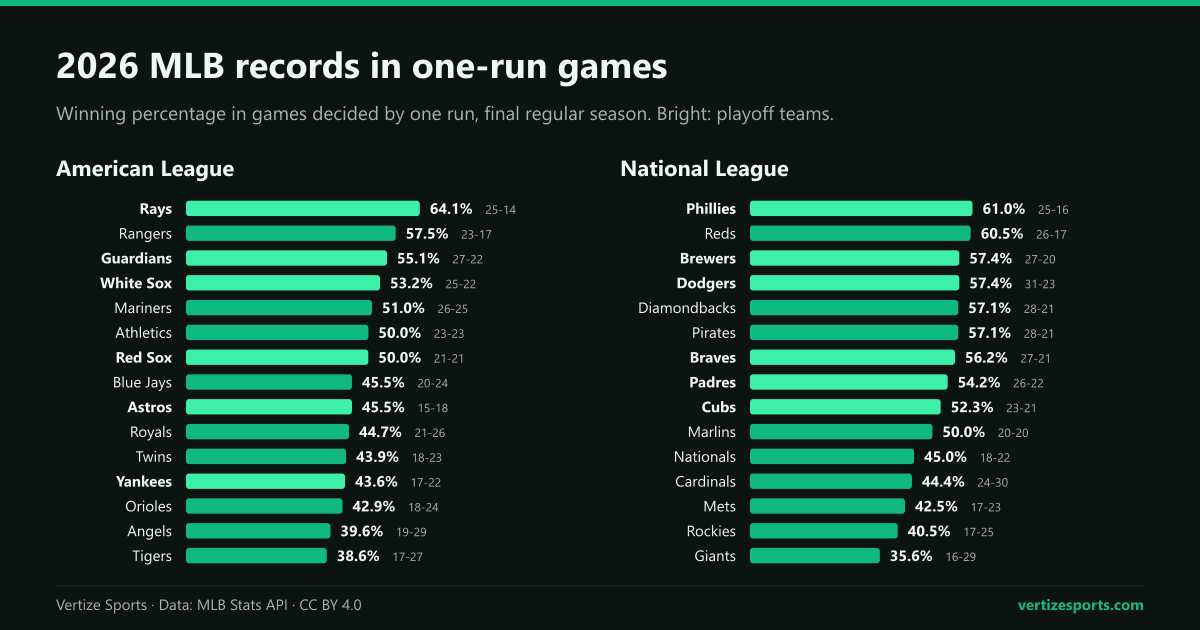
The Tampa Bay Rays had the best one-run record, 25-14, on the way to 98-64 and the American League's top seed, followed by the Phillies at 25-16, with a +15 differential. The Cincinnati Reds went 26-17 while being outscored by 160 runs, and the Los Angeles Dodgers won the most one-run games, 31, against 23 losses. The Chicago Cubs had the most walk-off wins, 13.
The San Francisco Giants were last at 16-29. The Detroit Tigers went 17-27 with a +71 differential and finished 76-86, and the Yankees, 17-22 in one-run games and 4-11 in extra innings, had the worst one-run record of the 12 playoff teams despite a +138 differential. Nine of the 12 playoff teams finished above .500 in one-run games, and across the 30 teams the correlation between run differential and one-run record was 0.36, close to the long-run 0.34.
In the postseason, 9 of the 28 games finished through October 12 were decided by one run, according to the Stats API, including three of the four in the Milwaukee Brewers' Division Series win over the San Diego Padres. The 2026 MLB playoff bracket has every series, and the Vertize MLB simulator rates teams on run differential, not on one-run records.
MLB one-run games: frequently asked questions
How many MLB games are decided by one run? About 28 percent: 18,100 of the 64,057 regular-season games decided from 2000 to 2026, 28.3 percent. In 2026 it was 27.5 percent.
What is the most common margin of victory in baseball? One run. Two runs decided 18.1 percent of games since 2000 and three runs 14.3 percent.
Are one-run games luck? Largely. A team's one-run winning percentage correlates at 0.03 with the next season's, and teams that won 60 percent or more of them won .495 the following year.
What is the best record in one-run games in a season? Since 2000, the 2016 Texas Rangers' 36-11, .766, just ahead of the 2012 Baltimore Orioles' 29-9. The 2019 San Francisco Giants won the most, 38.
How this was built: every MLB regular-season game from 2000 to 2026 from MLB's Stats API, with the final score and the line score, suspended games counted once; 35 empty 2000 records without a score were dropped, and the six ties are left out. Team wins, losses, runs, one-run and extra-inning records match the API's final standings for all 810 team-seasons. A walk-off is a home win in which the home team batted in the last inning. Correlations, tiers and year-to-year pairs use the 780 full seasons, without 2020. Postseason games through 12:05 p.m. ET on October 13, 2026, from the API's postseason schedule.