We counted every game in the nflverse games file since 1999, playoffs and the first three weeks of 2026 included, after checking its records and points against NFL.com's standings.
The most common margin of victory in the NFL: 3 points
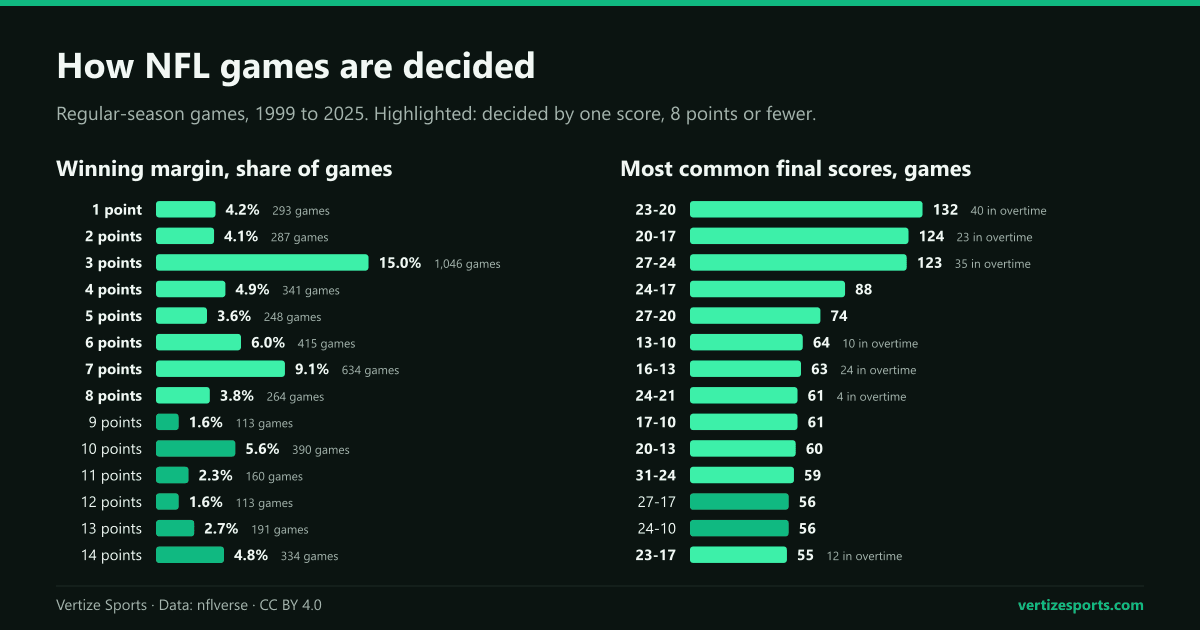
Under Rule 11 of the NFL rulebook, a touchdown is worth six points and the try after it one or two, so eight points is the most one possession can make up. Since 1999, 50.6 percent of regular-season games were decided by that much or less, 22.3 percent by nine to 16 points and 26.8 percent by 17 or more. Only 15 ended in a tie.
The margins follow the scoring values. Three points, a field goal, decided 1,046 games, 15.0 percent, and seven, a touchdown plus an extra point, decided 634, or 9.1 percent. Next come six, 10, four and 14 points; a one-point game (293) is rarer than a 10-point one (390).
| Final margin | Regular season | Share | Playoffs | Share |
|---|---|---|---|---|
| Tie | 15 | 0.2% | 0 | 0.0% |
| 1 point | 293 | 4.2% | 10 | 3.2% |
| 2 points | 287 | 4.1% | 8 | 2.6% |
| 3 points | 1,046 | 15.0% | 54 | 17.5% |
| 4 points | 341 | 4.9% | 14 | 4.5% |
| 5 points | 248 | 3.6% | 12 | 3.9% |
| 6 points | 415 | 6.0% | 21 | 6.8% |
| 7 points | 634 | 9.1% | 23 | 7.4% |
| 8 points | 264 | 3.8% | 7 | 2.3% |
| One score (1 to 8) | 3,528 | 50.6% | 149 | 48.2% |
| Two scores (9 to 16) | 1,555 | 22.3% | 73 | 23.6% |
| 17 points or more | 1,869 | 26.8% | 87 | 28.2% |
| All games | 6,967 | 100% | 309 | 100% |
NFL games decided by 3 points, and by 7
Three points was the most common margin in 26 of the 27 seasons from 1999 to 2025; in 2019, seven-point games won out, 32 to 27. Since the schedule grew to 17 games a team in 2021, about 40 games a season have been decided by exactly three points.
Overtime adds to that pile: 280 of the 1,046 three-point games went to overtime, more than a quarter. How NFL overtime works explains why overtime margins cluster at three and six points.
The most common NFL final score
Since 1999 it has been 23-20, with 132 regular-season games, just ahead of 20-17 (124) and 27-24 (123). But 40 of the 23-20 games went to overtime. In regulation alone, 20-17 leads with 101, and it has also been the most common score since 2015: 55 games, to 51 for 27-24 and 50 for 23-20.
| Final score | Games, 1999-2025 | In overtime | Games, 2015-2025 |
|---|---|---|---|
| 23-20 | 132 | 40 | 50 |
| 20-17 | 124 | 23 | 55 |
| 27-24 | 123 | 35 | 51 |
| 24-17 | 88 | 0 | 31 |
| 27-20 | 74 | 0 | 39 |
| 13-10 | 64 | 10 | 11 |
| 16-13 | 63 | 24 | 19 |
| 24-21 | 61 | 4 | 21 |
| 17-10 | 61 | 0 | 17 |
| 20-13 | 60 | 0 | 21 |
NFL one-score games by season, before and after rule changes
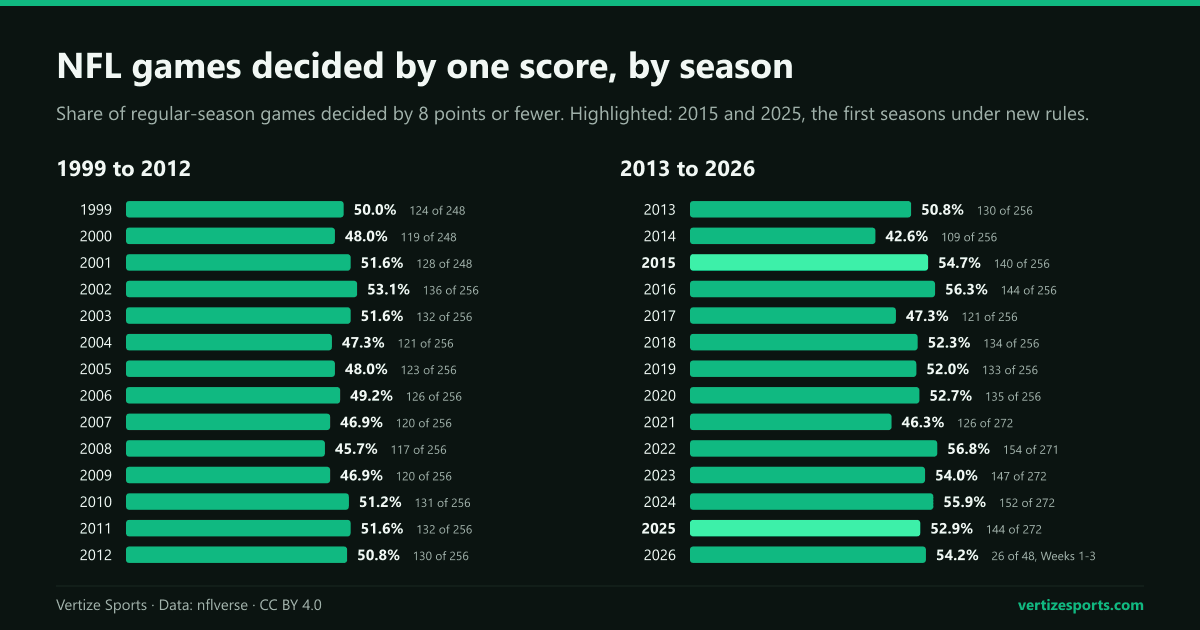
The share moves from year to year, from 42.6 percent in 2014 to 56.8 percent in 2022, and it has been higher since 2015: 49.1 percent of games from 1999 to 2014, 52.8 percent from 2015 to 2024. The five seasons with the highest shares all came in the second stretch: 2022, 2016, 2024, 2015 and 2023.
In 2015, the NFL moved the extra-point kick back to the 15-yard line, leaving two-point tries at the 2. Since then, six-point games have risen from 5.3 to 7.2 percent of the schedule and eight-point games from 3.4 to 4.4, while seven-point games have fallen from 9.4 to 8.6 percent. The timing alone does not show that the rule caused it; scoring also rose, from 43.2 to 45.5 points per game.
The next changes came in 2025, when owners made the kickoff tested in 2024 permanent, moved the touchback from the 30 to the 35 and gave both teams a possession in regular-season overtime. That first season, 52.9 percent of games were decided by one score, about the 2015-2024 rate, 15.1 percent by three points and 9.6 percent by seven.
One-score games in the NFL playoffs
Playoff games are slightly less likely to be one-score games and more likely to be decided by exactly three: of the 309 played from 1999 to 2025, 149 were decided by eight points or fewer, 48.2 percent, and 54, or 17.5 percent, by three. The most common playoff score is 20-17, nine times, five after overtime.
Super Bowls have been closer still: 15 of the 27 were decided by one score, eight of them by exactly three points, most recently the Kansas City Chiefs' 25-22 overtime win over the San Francisco 49ers after the 2023 season.
NFL records in one-score games by team
Over the last 10 seasons, 2016 to 2025, the Pittsburgh Steelers have the best record in one-score games, 69-32, and are the only team with a winning record in them every season. The Miami Dolphins (50-30) and the Chiefs (58-37) follow. The Jacksonville Jaguars are last at 27-53, behind the Cincinnati Bengals (30-52) and the Arizona Cardinals (30-49).
Since 2002, the first season with 32 teams, Pittsburgh (129-82), the New England Patriots (106-68) and the Indianapolis Colts (128-83) have each won about 61 percent of their one-score games, and the Cleveland Browns (83-116) and the Detroit Lions (86-120) about 42 percent.
| Team | One-score record | Win % | Winning seasons |
|---|---|---|---|
| Pittsburgh Steelers | 69-32 | 68.3% | 10 |
| Miami Dolphins | 50-30 | 62.5% | 8 |
| Kansas City Chiefs | 58-37 | 61.1% | 8 |
| Minnesota Vikings | 55-37 | 59.8% | 6 |
| Seattle Seahawks | 57-40 | 58.8% | 6 |
| Dallas Cowboys | 45-32 | 58.4% | 6 |
| Green Bay Packers | 52-37 | 58.4% | 6 |
| Philadelphia Eagles | 53-38 | 58.2% | 5 |
| Los Angeles Rams | 46-36 | 56.1% | 5 |
| Las Vegas Raiders | 49-40 | 55.1% | 5 |
| Buffalo Bills | 42-37 | 53.2% | 5 |
| New England Patriots | 40-36 | 52.6% | 5 |
| Washington Commanders | 43-39 | 52.4% | 6 |
| Tennessee Titans | 46-43 | 51.7% | 5 |
| Houston Texans | 49-48 | 50.5% | 6 |
| Indianapolis Colts | 46-49 | 48.4% | 4 |
| Tampa Bay Buccaneers | 43-46 | 48.3% | 3 |
| New Orleans Saints | 39-42 | 48.1% | 3 |
| Baltimore Ravens | 41-45 | 47.7% | 2 |
| Atlanta Falcons | 46-51 | 47.4% | 2 |
| Detroit Lions | 41-46 | 47.1% | 3 |
| Los Angeles Chargers | 45-55 | 45.0% | 3 |
| Denver Broncos | 39-50 | 43.8% | 2 |
| Cleveland Browns | 34-45 | 43.0% | 3 |
| San Francisco 49ers | 30-40 | 42.9% | 3 |
| New York Giants | 38-52 | 42.2% | 2 |
| Carolina Panthers | 36-51 | 41.4% | 3 |
| Chicago Bears | 37-53 | 41.1% | 4 |
| New York Jets | 34-49 | 41.0% | 1 |
| Arizona Cardinals | 30-49 | 38.0% | 1 |
| Cincinnati Bengals | 30-52 | 36.6% | 2 |
| Jacksonville Jaguars | 27-53 | 33.8% | 1 |
Single seasons swing much further. The 2022 Minnesota Vikings and the 2024 Chiefs went 11-0 in one-score games, the best records since 1999; the Vikings finished 13-4 while being outscored by three points. At the other end, the 2001 Carolina Panthers went 0-9 and the 2019 Bengals 0-8.
Do NFL one-score records carry over to the next season?
Barely. Across the 829 pairs of consecutive seasons from 1999 to 2025, the correlation between a team's winning percentage in one-score games one season and the next is 0.08, close to the zero that would mean no relationship. In games decided by nine points or more it is 0.36, and for overall winning percentage 0.33.
Teams that won at least 70 percent of their one-score games, with six or more of them, won 50.7 percent the next season, and about three in four had a worse overall record. Teams that won fewer than 30 percent won 47.0 percent the next season.
| Share of one-score games won | Team-seasons | One-score record | Next season | Overall win % | Next season |
|---|---|---|---|---|---|
| 70% or more | 120 | 791-215 (78.6%) | 489-476 (50.7%) | 71.1% | 54.7% |
| 30% to under 70% | 520 | 2,209-2,286 (49.1%) | 2,197-2,112 (51.0%) | 49.0% | 50.4% |
| Under 30% | 115 | 203-724 (21.9%) | 453-510 (47.0%) | 29.3% | 44.7% |
The Chiefs are the sharpest recent case. They went 11-0 in one-score games and 15-2 in 2024, then 1-9 and 6-11 in 2025 while still outscoring opponents by 34 points; only the 2001 Panthers have finished further below .500 in one-score games. The Vikings followed their 11-0 with 6-8 in one-score games and a 7-10 season. Baseball's one-run games follow the same pattern.
One-score games in the 2026 NFL season so far
Through Week 3, 26 of the 48 games have been decided by one score, 54.2 percent, six of them by three points and five by seven. Week 3 had 12 one-score games out of 16, tying the most in any week since 1999, which had happened 14 times before. The closest were the Indianapolis Colts' 19-17 win over the Houston Texans and the Washington Commanders' 33-31 win over the Seattle Seahawks.
NFL.com's standings have the Tampa Bay Buccaneers at 0-3, all three losses by one score: 33-27 at Cincinnati, 23-19 to Cleveland and 23-16 to Minnesota; our look at 0-3 starts shows what that record has meant before. Eight teams are 2-0 in one-score games, Pittsburgh among them, and Kansas City, 1-9 in them last season, has won its only one, 33-30 in overtime against Indianapolis.
The Vertize NFL simulator starts from the real standings with those 48 games locked; you can type a score into any of the 224 still to be played, or let the model fill them in. The NFL schedule has every result so far, week by week.
NFL one-score games: frequently asked questions
What is a one-score game in the NFL? A game decided by eight points or fewer: a touchdown and a two-point conversion, the most a team can make up with one possession.
How many NFL games are decided by one score? About half: 50.6 percent of regular-season games from 1999 to 2025, and 52.8 percent since 2015. In the playoffs the share is 48.2 percent.
What is the most common margin of victory in the NFL? Three points, in 15.0 percent of regular-season games since 1999. Seven points is second, at 9.1 percent.
What is the most common final score in the NFL? 23-20 since 1999, with 132 regular-season games, 40 of them after overtime. Counting only games decided in regulation, or all games since 2015, it is 20-17.
How many NFL games are decided by 3 points? 1,046 regular-season games from 1999 to 2025, 15.0 percent, or about 40 a season since the schedule grew to 17 games in 2021.
How this was built: every regular-season and playoff game from 1999 to 2025, and the 48 games of Weeks 1 to 3 of 2026, from the nflverse games file, downloaded on September 30, 2026. A one-score game is decided by eight points or fewer; ties count as games but not as one-score results, and team records leave them out. Franchises that moved count as one team. Records and points match NFL.com's standings for all 890 team-seasons its pages list (they omit one NFC East team in 1999, 2000 and 2001), and the 2026 scores match NFL.com's schedule.