We counted every fourth-down play since 1999 in nflverse's play-by-play data: runs, passes, punts and field-goal tries, 102,661 of them in the regular season from 1999 to 2025. Plays wiped out by a penalty are left out. Going for it means a run or a pass, fakes included; a conversion is a first down or a touchdown. Game types come from the nflverse games file.
NFL fourth-down go-for-it rate by season since 1999
For 19 seasons almost nothing moved. From 1999 to 2017 teams went for it on between 11.1 percent of fourth downs, in 2011, and 14.4 percent, in 2009. Then the rate climbed: 14.8 percent in 2018, 16.2 in 2019, 19.1 in 2020 and 20.9 in 2021. It held near 20 percent for three seasons and reached 23.3 percent in 2025. Every season since 2018 is above every season before it.
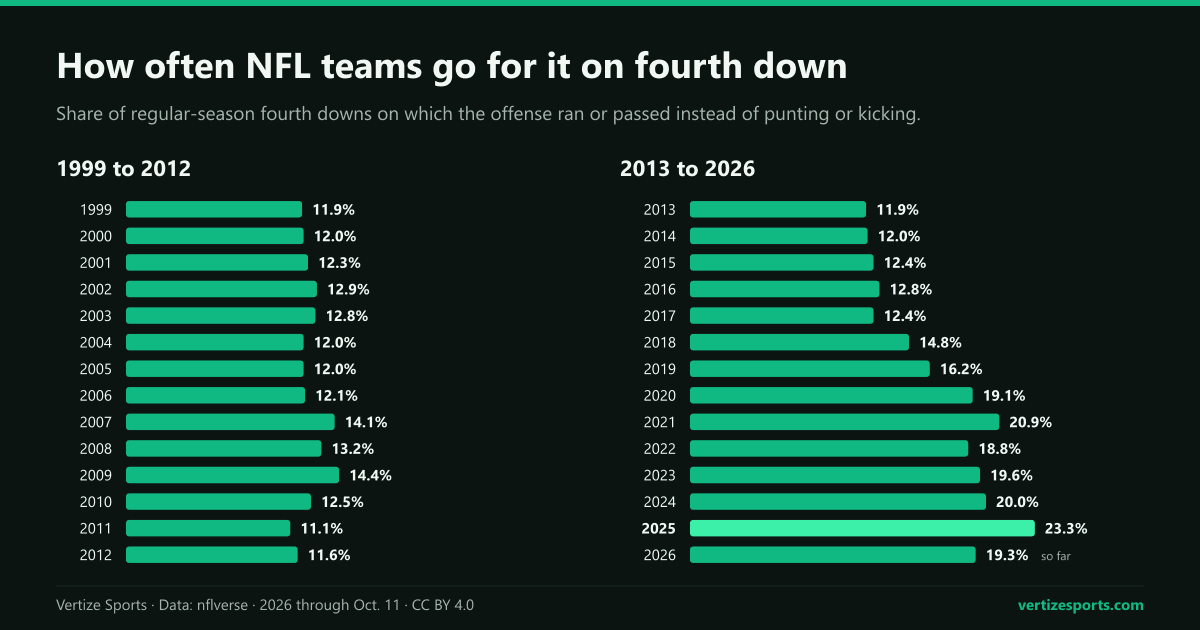
That works out to 1.62 attempts per team per game in 2025. The kicks paid for it: punts were 64 percent of fourth-down plays from 1999 to 2017 and 51 percent in 2025, while field-goal tries rose a little, from 23 to 26 percent.
Desperation does not explain the jump. In the fourth quarter and overtime, 80 percent of attempts from 2021 to 2025 came from teams that were behind, which is what you would expect when the team ahead at halftime wins 77 percent of the time. But the rate more than doubled in the first three quarters too, from 6.6 percent in 1999 to 17.7 percent in 2025. The clearest case is fourth-and-1 or 2 in the first three quarters between a team's own 30 and the opponent's 40, where punting used to be the default: teams went for it 17 percent of the time in 1999 and 61 percent in 2025.
| Season | Fourth downs | Went for it | Go rate | Go rate, quarters 1-3 | Go rate on 4th and 1 | Converted |
|---|---|---|---|---|---|---|
| 1999 | 3,923 | 466 | 11.9% | 6.6% | 36.8% | 43.8% |
| 2011 | 3,845 | 428 | 11.1% | 5.6% | 36.1% | 43.5% |
| 2017 | 3,869 | 481 | 12.4% | 7.6% | 43.9% | 46.4% |
| 2018 | 3,611 | 535 | 14.8% | 9.9% | 56.1% | 56.1% |
| 2020 | 3,421 | 655 | 19.1% | 13.9% | 66.3% | 55.3% |
| 2021 | 3,800 | 793 | 20.9% | 15.8% | 69.7% | 53.1% |
| 2024 | 3,826 | 764 | 20.0% | 15.4% | 70.4% | 56.8% |
| 2025 | 3,793 | 882 | 23.3% | 17.7% | 76.3% | 55.4% |
| 2026 (to Oct. 11) | 1,100 | 212 | 19.3% | 14.4% | 78.3% | 53.8% |
Fourth-down conversion rate by yards to go
Distance decides almost everything. Over the 27 seasons from 1999 to 2025, fourth-and-1 was converted 66 percent of the time, fourth-and-2 54 percent and fourth-and-3 49 percent; from four or five yards it was 45 percent, from six to nine 37 percent and from 10 or more 25 percent.
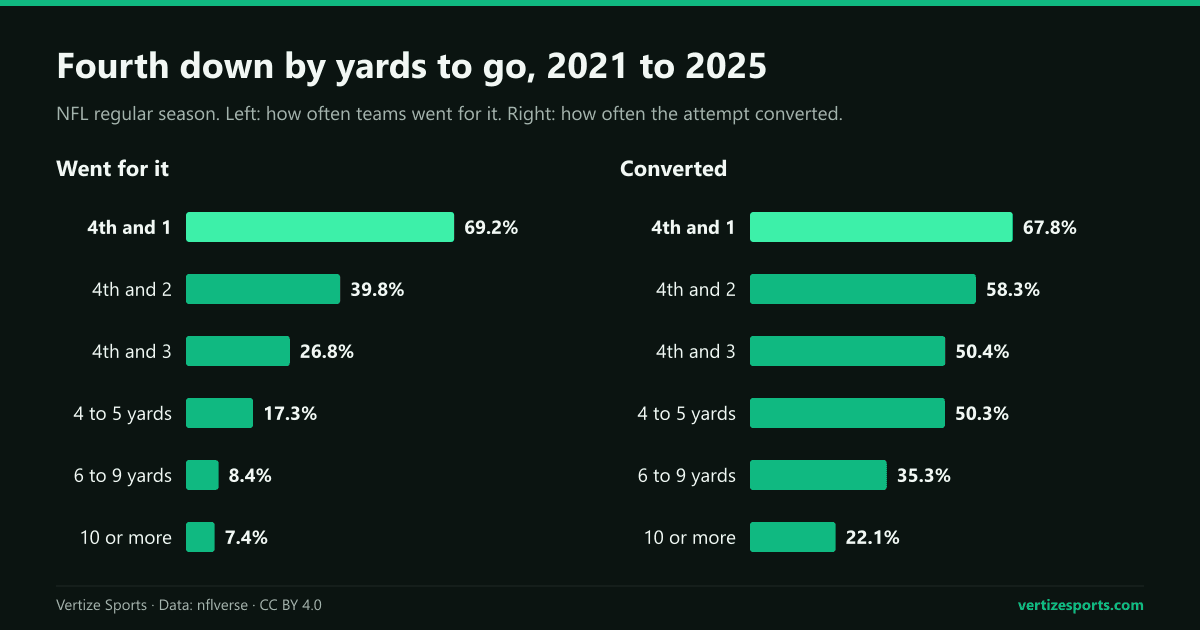
The new aggressiveness is a short-yardage story. Teams went for it on 41.6 percent of fourth-and-1s from 1999 to 2017 and 69.2 percent from 2021 to 2025, and on fourth-and-2 the rate more than doubled. With six or more yards to go it barely changed. That shift is also why the overall conversion rate went up, from 48.4 percent in 1999-2017 to 53.5 percent in 2018-2025: more of the attempts are short ones.
| Yards to go | Go rate 1999-2017 | Go rate 2021-2025 | Attempts 2021-2025 | Converted 2021-2025 |
|---|---|---|---|---|
| 4th and 1 | 41.6% | 69.2% | 1,585 | 67.8% |
| 4th and 2 | 17.3% | 39.8% | 602 | 58.3% |
| 4th and 3 | 13.1% | 26.8% | 395 | 50.4% |
| 4 to 5 yards | 10.6% | 17.3% | 513 | 50.3% |
| 6 to 9 yards | 6.4% | 8.4% | 414 | 35.3% |
| 10 or more | 6.8% | 7.4% | 458 | 22.1% |
Going for it by field position
Field position matters too. The share of fourth downs teams went for in 1999-2017 and in 2021-2025, with the conversion rate of the recent attempts:
- Own 1 to 29: 3.5 percent then, 5.5 percent now; converted 47.2 percent.
- Own 30 to 49: 7.0 percent, now 15.2; converted 53.1 percent.
- Midfield to the opponent's 35: 21.0 percent, now 35.1, the biggest jump outside the goal line. Too far for a routine field goal, too close for a useful punt; converted 54.8 percent.
- Opponent's 34 to 21: 22.8 percent, now 25.8, a small change, because this is field-goal range; converted 52.1 percent.
- Opponent's 20 to 6: 15.0 percent, now 22.1; converted 54.7 percent.
- Opponent's 5 to 1: 31.6 percent, now 53.5, the highest rate on the field; converted 56.4 percent, and here only a touchdown counts.
Fourth-and-1: run, pass or quarterback
On fourth-and-1, running beats passing. From 1999 to 2025, runs converted 70 percent of 4,242 attempts and passes 54 percent of 1,420. The best option was the quarterback keeping the ball: carries by a team's quarterback that were not scrambles converted 80 percent of 1,273 tries, against 66 percent for every other run.
The play-by-play records who carried the ball, but it does not label quarterback sneaks, nor the Philadelphia Eagles' 'tush push', in which teammates shove the quarterback from behind; Jalen Hurts's short-yardage carries are logged both up the middle and over the left guard. So we do not count sneaks or the push as such. The quarterback carries show the trend anyway: 36 a season on fourth-and-1 from 1999 to 2017, 83 a season from 2021 to 2025.
The Eagles used it most. From 2021 to 2025 their quarterbacks carried on 41 fourth-and-1s and converted 38, 93 percent, 35 of them by Hurts; the Buffalo Bills were next with 24 and 21 converted, 23 of them by Josh Allen. The push itself stays legal in 2026: no ban was put to a vote this year after one fell two votes short in 2025.
The most and least aggressive NFL teams on fourth down
To rank teams we use the first three quarters, where the choice is a real one; late in games the score makes it for them. In the first three quarters only 52 percent of attempts from 2021 to 2025 came from teams that were behind. On that measure the Detroit Lions are in a class of their own: they went for it on 114 of 409 fourth downs, 27.9 percent, and no other team reached 20 percent. The Seattle Seahawks were the most conservative, 38 of 413, 9.2 percent.
| Team | Fourth downs, quarters 1-3 | Went for it | Go rate 2021-2025 | Go rate 2025 |
|---|---|---|---|---|
| Detroit Lions | 409 | 114 | 27.9% | 23.7% |
| Indianapolis Colts | 447 | 87 | 19.5% | 26.7% |
| Philadelphia Eagles | 405 | 78 | 19.3% | 11.9% |
| Chicago Bears | 457 | 88 | 19.3% | 22.8% |
| Dallas Cowboys | 406 | 77 | 19.0% | 25.3% |
| Denver Broncos | 469 | 53 | 11.3% | 11.5% |
| New Orleans Saints | 454 | 51 | 11.2% | 14.8% |
| Houston Texans | 489 | 47 | 9.6% | 11.7% |
| Seattle Seahawks | 413 | 38 | 9.2% | 12.3% |
Detroit also has the two most aggressive single seasons since 1999 on this measure, 32.8 percent in 2024 and 29.9 percent in 2023, and four of the top 10. The only team in that top 10 from before 2020 is the 2007 Jacksonville Jaguars, at 29.3 percent. In 2025 the Buffalo Bills (19 of 68) and the Los Angeles Rams (21 of 76) led the league, and the Los Angeles Chargers were last, 8 of 86.
Raw attempt counts tell a different story. The most in one season since 1999 belong to the 2023 Carolina Panthers, 48, but only 22 came in the first three quarters and the other 26 in the fourth quarter or overtime. Late attempts follow the scoreboard, and in a league where about half of all games end within one score, many teams are close enough behind to need them.
Fourth-down decisions in the 2026 NFL season so far
Through Sunday 11 October, the first four weeks and the 14 games of Week 5 played by then, teams went for it on 212 of 1,100 fourth downs, 19.3 percent, and converted 53.8 percent. That is a little behind 2025, which stood at 20.8 percent after five weeks, and in line with 2021 to 2024. In the first three quarters the rate is 14.4 percent, slightly ahead of 2025 at the same stage.
Fourth-and-1 is where 2026 stands out: teams have gone for it 90 times in 115 chances, 78 percent, a higher rate than in the first five weeks of any season since 2018. In the first three quarters, the Kansas City Chiefs (7 of 19, in four games; they had a bye in Week 5) and the Chicago Bears (9 of 27) have been the most aggressive, and the Denver Broncos and the Minnesota Vikings the least, one attempt each. Five games are a small sample.
The NFL schedule has every result so far, and the Vertize NFL simulator lets you pick the remaining games and see the standings that follow.
NFL fourth downs: frequently asked questions
How often do NFL teams go for it on fourth down? On 23.3 percent of fourth downs in the 2025 regular season, the highest rate since at least 1999, and on 19.3 percent in 2026 through 11 October. From 1999 to 2017 the rate was between 11 and 15 percent every year.
What is the NFL fourth-and-1 conversion rate? About two in three: 66 percent from 1999 to 2025, and 67.8 percent from 2021 to 2025. Runs convert more often than passes, and quarterback carries most often of all.
Which NFL team goes for it on fourth down the most? The Detroit Lions: 27.9 percent of their fourth downs in the first three quarters from 2021 to 2025, far ahead of any other team, and the most attempts overall, 182.
How this was built: every fourth-down run, pass, punt and field-goal try in the NFL regular season and playoffs from 1999 to 2026, from the play-by-play in nflverse-data, with game types and finished games checked against the nflverse games file. Plays nullified by a penalty and kneel-downs are left out; fakes count as going for it. A conversion is a first down or a touchdown on the play. A quarterback carry is a run, not a scramble, by a player with at least 20 pass attempts that season. A few early games have no play-by-play in nflverse. The 2026 figures cover the 78 games finished by 11 October 2026; our 2025 total of 882 attempts is within a handful of published counts, which treat fakes and penalties differently. The playoffs followed the same trend: 14.1 percent of fourth downs in 1999-2017, 21.5 percent in 2018-2025.