We went through every regular-season run and pass since 1999 in nflverse's play-by-play data, with finished games from the nflverse games file: 6,964 games from 1999 to 2025 and 79 in 2026. The passer rating uses the NFL's official formula, which the Pro Football Hall of Fame explains, on each season's league totals.
Average NFL passer rating by year since 1999
The climb was steady. Four of the first five seasons in the data finished under 80, and since 2014 no season has been below 86.9. The three highest are 2020 at 93.6, 2018 at 92.9 and 2024 at 92.3. Across all passes from 1999 to 2025 the league rated 85.7.
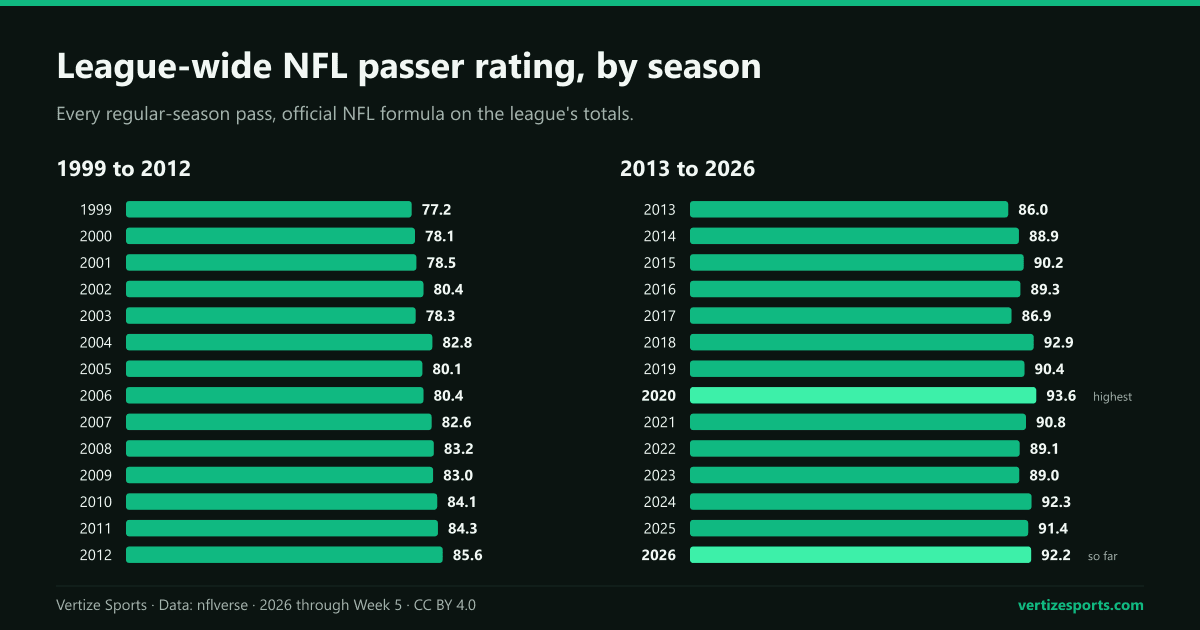
The formula adds four parts: completions, yards, touchdowns and interceptions per attempt. Of the 14.1 points gained between 1999 and 2025, higher completion rates added 6.0 and fewer interceptions 4.9, more than three quarters of the rise. Touchdown passes added 2.3 and yards per attempt only 1.0: quarterbacks complete more throws and give the ball away less, but each attempt gains only a little more ground.
The records since 1999, by category:
- Completion percentage: 65.3 percent in 2024, just ahead of 65.2 in 2020, against 57.2 in 1999.
- Yards per attempt: 7.37 in 2018; the low was 6.64 in 2003. Net of sacks, 6.42 in both 2018 and 2020 and 5.83 in 2003.
- Interception rate: 2.17 percent of attempts in 2024 and 2.18 in 2025, the two lowest, against 3.37 in 2001. Per team game, interceptions fell from 1.13 in 1999 to 0.70 in 2025.
- Sack rate, sacks per pass attempt plus sack: 5.76 percent in 2016, the lowest, and 7.15 in 2023, the highest; 2024 and 2025 were both at 6.87.
- Touchdown rate: 4.8 percent of attempts in 2020, the season NFL scoring hit its record of 24.8 points per team game, with 1.70 passing touchdowns per team game.
| Season | Passer rating | Completion % | Yards per attempt | Net yards per attempt | INT % | Sack % |
|---|---|---|---|---|---|---|
| 2026 (Weeks 1-5) | 92.2 | 64.3% | 7.08 | 6.22 | 2.08% | 6.39% |
| 2025 | 91.4 | 64.3% | 7.02 | 6.09 | 2.18% | 6.87% |
| 2024 | 92.3 | 65.3% | 7.13 | 6.19 | 2.17% | 6.87% |
| 2023 | 89.0 | 64.5% | 7.02 | 6.04 | 2.35% | 7.15% |
| 2022 | 89.1 | 64.2% | 7.03 | 6.12 | 2.31% | 6.70% |
| 2021 | 90.8 | 64.8% | 7.10 | 6.22 | 2.35% | 6.23% |
| 2020 | 93.6 | 65.2% | 7.24 | 6.42 | 2.19% | 5.93% |
| 2019 | 90.4 | 63.5% | 7.22 | 6.29 | 2.30% | 6.67% |
| 2018 | 92.9 | 64.9% | 7.37 | 6.42 | 2.37% | 6.76% |
| 2017 | 86.9 | 62.1% | 7.01 | 6.15 | 2.46% | 6.40% |
| 2016 | 89.3 | 63.0% | 7.15 | 6.37 | 2.27% | 5.76% |
| 2015 | 90.2 | 63.0% | 7.25 | 6.41 | 2.38% | 6.09% |
| 2014 | 88.9 | 62.6% | 7.21 | 6.35 | 2.52% | 6.35% |
| 2013 | 86.0 | 61.2% | 7.12 | 6.21 | 2.77% | 6.66% |
| 2012 | 85.6 | 60.9% | 7.08 | 6.25 | 2.63% | 6.17% |
| 2011 | 84.3 | 60.1% | 7.20 | 6.32 | 2.90% | 6.39% |
| 2010 | 84.1 | 60.8% | 7.00 | 6.16 | 2.95% | 6.13% |
| 2009 | 83.0 | 60.9% | 6.98 | 6.17 | 3.08% | 6.06% |
| 2008 | 83.2 | 61.0% | 6.94 | 6.16 | 2.81% | 5.90% |
| 2007 | 82.6 | 61.2% | 6.85 | 6.05 | 3.15% | 6.02% |
| 2006 | 80.4 | 59.8% | 6.85 | 5.97 | 3.17% | 6.61% |
| 2005 | 80.1 | 59.5% | 6.78 | 5.90 | 3.09% | 6.69% |
| 2004 | 82.8 | 59.8% | 7.05 | 6.14 | 3.20% | 6.81% |
| 2003 | 78.3 | 58.8% | 6.64 | 5.83 | 3.27% | 6.24% |
| 2002 | 80.4 | 59.6% | 6.72 | 5.88 | 3.05% | 6.36% |
| 2001 | 78.5 | 59.0% | 6.78 | 5.87 | 3.37% | 6.88% |
| 2000 | 78.1 | 58.2% | 6.75 | 5.85 | 3.25% | 6.99% |
| 1999 | 77.2 | 57.2% | 6.77 | 5.86 | 3.35% | 6.94% |
NFL pass rate by season: how often teams throw
Counting sacks and quarterback scrambles as pass plays, teams dropped back on 60.4 percent of their plays in 1999 and 60.1 percent in 2025, and every season in between landed from 57.1 percent, in 2006, to 62.0 percent, in 2015.
Game situations blur that number, because teams that trail throw and teams that lead run. On first and second down in the first three quarters, outside the last two minutes of the half and with the score within seven points, the share of dropbacks went from 49.8 percent in 1999 to a low of 46.1 in 2005 and a high of 52.0 in 2023; 2025 was at 51.0. It stayed under half every season from 2003 to 2012 and has been above half every season since 2018.
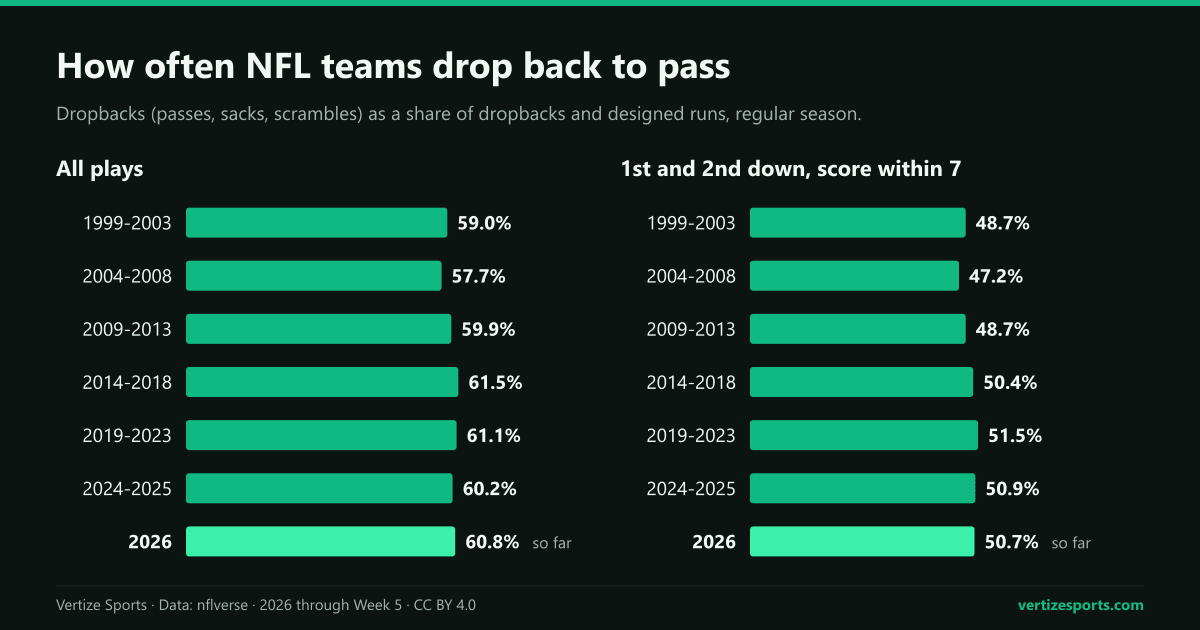
Volume has fallen. Teams averaged 35.7 pass attempts a game in 2015 and 32.1 in 2025, the fewest since 2006, as games have slowed: both teams together ran 122.5 offensive plays a game in 2025, the fewest since 1999. With fewer throws, passing yards per team game fell from 259.2 in 2015 to 225.0 in 2025, the fewest since 2008 and below the 228.3 of 1999. The big change in play calling has come on fourth down instead, where teams went for it 23.3 percent of the time in 2025, nearly double the 1999 rate.
| Season | Pass rate | Pass rate, early downs, score within 7 | Attempts per team game | Passing yards per team game | 300-yard games |
|---|---|---|---|---|---|
| 2026 (Weeks 1-5) | 60.8% | 50.7% | 33.1 | 234.3 | 26 |
| 2025 | 60.1% | 51.0% | 32.1 | 225.0 | 68 |
| 2024 | 60.3% | 50.9% | 32.7 | 233.5 | 83 |
| 2023 | 61.2% | 52.0% | 33.7 | 236.3 | 106 |
| 2022 | 60.1% | 50.2% | 33.3 | 234.4 | 93 |
| 2021 | 61.2% | 51.7% | 34.4 | 244.1 | 112 |
| 2020 | 61.4% | 51.9% | 35.2 | 254.9 | 132 |
| 2019 | 61.9% | 51.6% | 34.9 | 251.8 | 132 |
| 2018 | 61.9% | 51.5% | 34.5 | 254.4 | 132 |
| 2017 | 60.5% | 49.4% | 34.2 | 239.6 | 98 |
| 2016 | 61.9% | 50.6% | 35.7 | 255.6 | 118 |
| 2015 | 62.0% | 50.6% | 35.7 | 259.2 | 132 |
| 2014 | 61.0% | 50.0% | 34.9 | 251.8 | 123 |
| 2013 | 61.3% | 50.2% | 35.4 | 252.3 | 118 |
| 2012 | 60.3% | 49.5% | 34.7 | 246.0 | 126 |
| 2011 | 59.9% | 48.1% | 34.0 | 245.0 | 121 |
| 2010 | 59.5% | 48.1% | 33.7 | 236.2 | 96 |
| 2009 | 58.4% | 47.4% | 33.3 | 232.3 | 104 |
| 2008 | 57.7% | 48.3% | 32.3 | 224.2 | 75 |
| 2007 | 58.6% | 48.2% | 33.3 | 228.2 | 81 |
| 2006 | 57.1% | 46.3% | 32.0 | 219.2 | 65 |
| 2005 | 57.3% | 46.1% | 32.2 | 218.2 | 64 |
| 2004 | 57.6% | 47.4% | 31.9 | 225.3 | 81 |
| 2003 | 57.3% | 46.5% | 32.2 | 213.9 | 60 |
| 2002 | 59.6% | 50.1% | 33.8 | 227.0 | 79 |
| 2001 | 58.6% | 48.5% | 32.6 | 221.0 | 72 |
| 2000 | 59.3% | 48.8% | 32.9 | 222.2 | 65 |
| 1999 | 60.4% | 49.8% | 33.7 | 228.3 | 71 |
300-yard passing games by season
A quarterback threw for 300 yards or more 132 times in each of 2015, 2018, 2019 and 2020, the most of any season since 1999. In 2025 it happened 68 times, the fewest since 2006, about once every eight team games, the same rate as 2005; only 2003, with 60, had a lower rate. 400-yard games peaked at 24 in 2013 and 2018 and numbered 6 in 2025.
Passing yards are attempts times yards per attempt, and both are below their peaks: 32.1 attempts at 7.02 yards in 2025, against 35.7 at 7.25 in 2015.
NFL rule changes behind the passing trends
Three moments in the rulebook line up with the numbers, though a jump in one season does not prove the rule caused it, and most of the climb came gradually.
- Illegal contact, 2004. After the New England Patriots beat the Indianapolis Colts in the AFC Championship Game in January 2004, Colts president Bill Polian pressed the competition committee to better enforce defensive holding and illegal contact, and the league agreed. Yards per attempt went from 6.64 in 2003, the lowest of the period, to 7.05 in 2004; the league rating rose from 78.3 to 82.8 and 300-yard games from 60 to 81. 2005 slipped back to 6.78 yards and an 80.1 rating.
- Protecting the passer, 2002 to 2009. The NFL's list of health and safety rule changes bans helmet-to-helmet hits on a quarterback after a change of possession from 2002, low hits on the quarterback when a rusher can avoid them from 2006 and lunging at a passer's knees from 2009. The league rating moved by less than half a point in 2006 and in 2009.
- Body weight, 2018. The point of emphasis asked defenders to avoid putting their body weight on the quarterback, a provision of the roughing-the-passer rule since 1995; in September the competition committee kept it while clarifying the techniques. The 2018 rating rose 6.0 points, from 86.9 to 92.9, the biggest one-year gain since 1999, with completions up from 62.1 to 64.9 percent, 7.37 yards per attempt, the most since 1999, and 300-yard games up from 98 to 132. The flags are counted in our study of NFL penalties by season.
NFL passing in 2026 so far
Through Week 5, which ended with the Buffalo Bills' 37-34 win over the Los Angeles Rams on Monday, Oct. 12, the league passer rating is 92.2 in 79 games. Over a full season that would rank fourth since 1999, but early weeks flatter passers: the rating fell after Week 5 in 23 of the 27 seasons from 1999 to 2025 and on average ended 1.2 points lower. At the same point of 2025 it was 93.7.
- Completions: 64.3 percent, against 66.0 after five weeks of 2025, the lowest at this stage since 2022 (64.0).
- Yards per attempt: 7.08, up from 7.00; net of sacks, 6.22 against 6.13.
- Interceptions: 2.08 percent of attempts, the second-lowest rate after five weeks since 1999, behind 2025 at 2.06.
- Sacks: 6.39 percent of pass plays, about the 6.42 of early 2025.
- Pass rate: 60.8 percent of plays, and 50.7 percent on early downs with the score within seven, down from 61.3 and 52.6.
- 300-yard games: 26, against 22 after five weeks of 2025 and 24 in 2024, far from the 57 of 2018.
Week 6 starts on Thursday, Oct. 15. The NFL schedule has every result so far, and the Vertize NFL simulator lets you play out the rest of the season.
NFL passer rating and pass rate: frequently asked questions
What is the average NFL passer rating? The league-wide rating was 91.4 in the 2025 regular season and is 92.2 in 2026 through Week 5. The highest since 1999 is 93.6, in 2020.
How often do NFL teams pass? On about 60 percent of plays, counting sacks and scrambles: 60.1 percent in 2025. On early downs with the score within seven points it is close to half, 51.0 percent.
Are there fewer 300-yard passing games now? Yes: 68 in 2025, against 132 in 2020, because teams throw fewer passes a game and gain fewer yards per throw. 2026 has 26 through Week 5.
How this was built: every regular-season dropback and designed run from 1999 to 2026 in the nflverse play-by-play (2026 file updated Oct. 13), with finished games from the nflverse games file; 2026 covers Weeks 1 to 5, through Oct. 12. Three games of 1999 and 2000 have no play-by-play. Dropbacks are pass attempts, sacks and quarterback scrambles; kneel-downs, spikes, two-point tries and plays wiped out by a penalty are left out of the pass rate. Attempts include spikes, as nflverse's team statistics do. Our passing totals match them exactly in 20 of the 27 seasons and are never more than three attempts or 19 yards apart. A 300-yard game is one passer's total in one game.