We added up the drive-by-drive time of possession of every NFL game since 1999 in nflverse's play-by-play data, which carries the league's official drive charts, and took final scores and game types from its games file. We kept every game in which the two teams' regulation drives add up to 60 minutes and their first-half drives to 30, within 10 seconds; that leaves out 27 of the 6,967 regular-season games from 1999 to 2025 and none of the 309 playoff games. Our totals match the official time of possession of all six Super Bowls we checked against their box scores, such as Super Bowl LVII, to the second.
How often the team with more time of possession wins
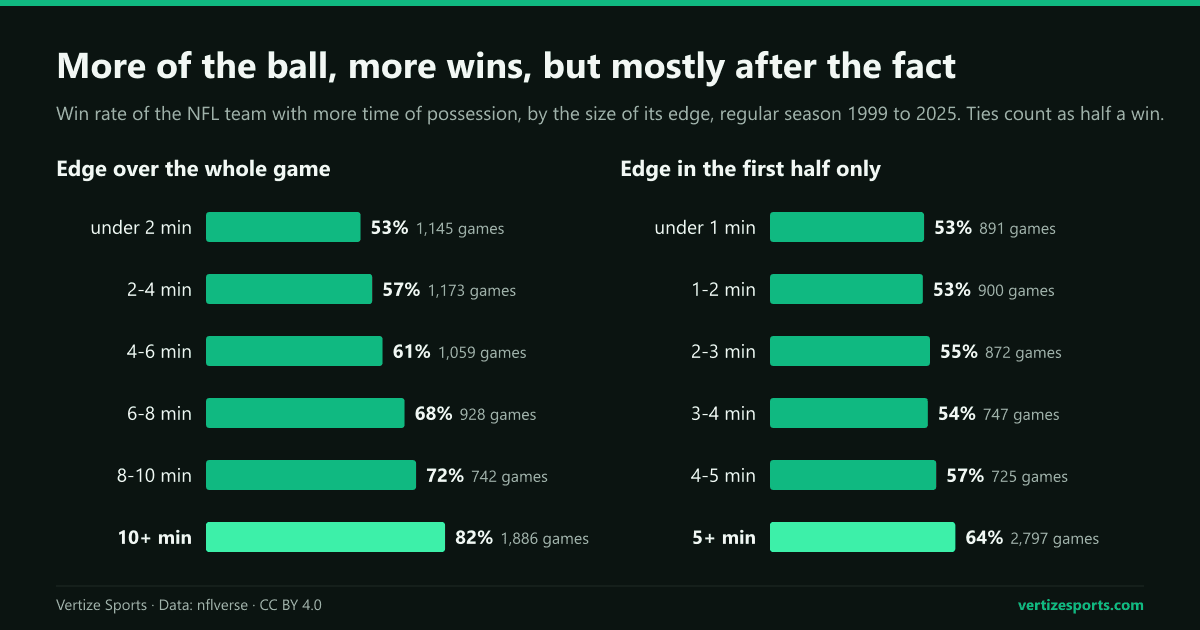
In 6,933 regular-season games one team had the ball longer, and that team went 4,648-2,270-15, a 67 percent win rate. The bigger the edge, the higher the rate: 53 percent when it was under two minutes, 82 percent at 10 minutes or more. A team that held the ball for 40 minutes or more went 128-11, 92 percent.
| Possession edge | Games | Won-lost-tied | Win rate | Average final margin |
|---|---|---|---|---|
| Under 2 minutes | 1,145 | 609-534-2 | 53.3% | +1.2 |
| 2 to 4 minutes | 1,173 | 672-500-1 | 57.3% | +2.1 |
| 4 to 6 minutes | 1,059 | 643-412-4 | 60.9% | +3.6 |
| 6 to 8 minutes | 928 | 634-291-3 | 68.5% | +5.8 |
| 8 to 10 minutes | 742 | 536-203-3 | 72.4% | +6.5 |
| 10 minutes or more | 1,886 | 1,554-330-2 | 82.4% | +10.8 |
In the playoffs the team with more possession won 215 of 308 games, 70 percent. Possession and winning go together; the question is which comes first.
First half vs whole game: time of possession before game script
The cleanest test is the first half, before the score starts to dictate play calling. The team with more first-half possession won 58 percent of regular-season games, 4,031-2,886-15, and 56 percent of playoff games. The team with more second-half possession won 66 percent.
Even that first-half edge works mostly through the scoreboard. The team that held the ball longer before halftime was ahead at the break in 58 percent of games. When it led it won 79 percent, about what any halftime leader wins, 77 percent; when it trailed it won 25 percent. Of the 546 regular-season games tied at halftime since 1999, 545 have complete drive data, and in 544 of them one team had more first-half possession. That team went 266-276-2, 49 percent.
In those same tied games, the team that had more of the ball after halftime won 64 percent of the time, which is what you would expect if the team that scored first then ran out the clock.
Time of possession when leading vs trailing
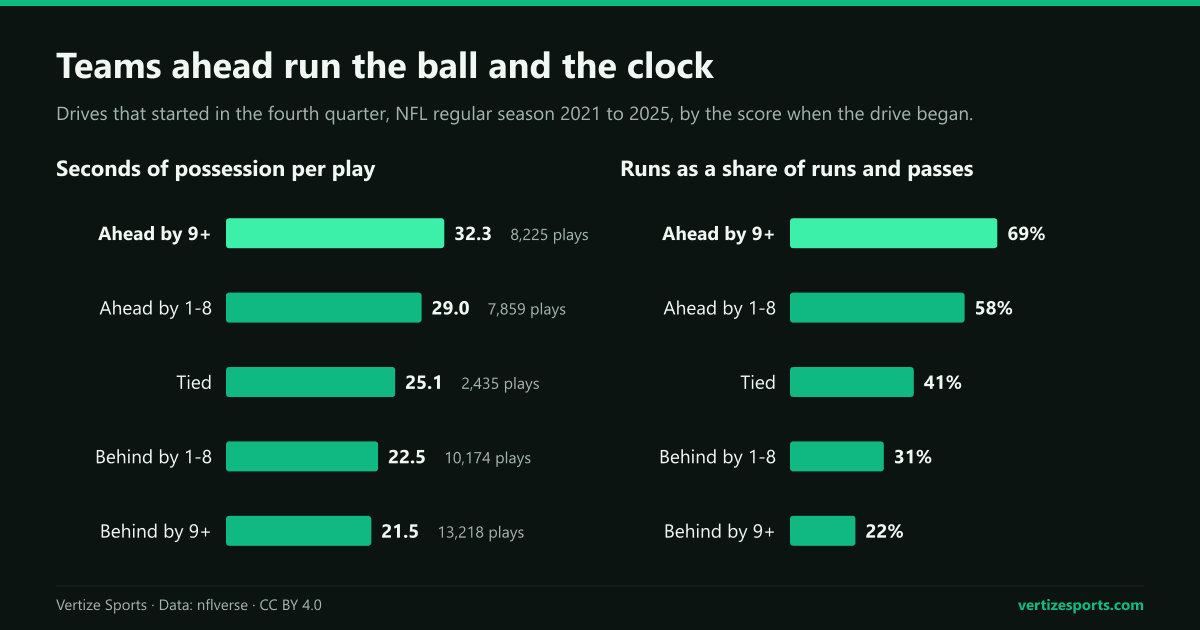
Leading teams change how they play. Under Rule 4 of the NFL rulebook, the game clock stops when a forward pass is incomplete or the ball goes out of bounds, so a team ahead keeps the ball on the ground and in bounds, and a team behind throws. On drives that began in the fourth quarter from 2021 to 2025, teams ahead by nine or more used 32.3 seconds of possession per play and ran on 69 percent of their runs and passes; teams behind by nine or more used 21.5 seconds and ran 22 percent of the time.
Kneel-downs make up 10 percent of the plays of fourth-quarter drives by teams up nine or more, the purest form of turning a lead into possession.
| Halftime lead | Games | Leader's second-half possession | Leader had the ball longer |
|---|---|---|---|
| 1 to 3 points | 1,243 | 15:12 | 667 (54%) |
| 4 to 7 points | 1,984 | 15:25 | 1,097 (55%) |
| 8 to 14 points | 1,969 | 15:45 | 1,176 (60%) |
| 15 or more | 1,182 | 16:16 | 796 (67%) |
The size of the lead decides how much of the second half the leader keeps. With one to three points the leader averaged 15:12 of the 30 minutes and had more of the ball in 54 percent of games; with 15 or more it averaged 16:16 and had more in 67 percent.
Season time of possession vs win percentage and point differential
Across 807 team seasons from 1999 to 2025 with complete drive data, the correlation between time of possession per game and win rate was 0.52. Point differential, at 0.91, and turnover differential, at 0.65, track winning more closely. Once point differential is known, possession adds almost nothing: the partial correlation between possession and win rate falls to 0.04.
It also says little about what comes next. Possession over the first half of a team's schedule correlated at 0.21 with its win rate over the second half, against 0.47 for point differential and 0.42 for the win rate itself, and it added nothing once point differential was known.
- Possession leaders: the team with the most time of possession per game made the playoffs in 21 of 27 seasons; the team with the best point differential made it in all 27.
- Teams that rarely had the ball: the lowest team in each season made the playoffs once, the 2013 Philadelphia Eagles, 10-6 with 26:24 a game.
- Ranges: teams averaging 32 minutes or more won 66 percent of their games, and teams under 29 minutes won 36 percent.
- Champions: of the 25 Super Bowl winners of the 2000 to 2025 seasons with complete data, one led the league in possession, the 2017 Eagles; the median rank was ninth, and the 2021 Los Angeles Rams ranked 26th.
- Season extremes since 1999: the 2019 Baltimore Ravens held the ball 34:47 a game and went 14-2; the 1999 Cleveland Browns had it 23:56 a game and went 2-14.
NFL record time of possession games since 1999
The three biggest edges came in wins by 21 points or more, but two of the six biggest went to the team that lost.
- Most possession: the Pittsburgh Steelers, 47:49 in a 43-0 win at the Cleveland Browns on September 12, 1999, the most by any team since 1999, overtime included.
- Most with overtime: the New York Jets, 47:08 in a 26-20 overtime win at Cleveland on November 14, 2010. The Arizona Cardinals had the ball 46:21 against the Seattle Seahawks on October 23, 2016, and the game ended 6-6.
- Least in a win: the Indianapolis Colts beat the Miami Dolphins 27-23 on September 21, 2009 with 14:53 of possession, against Miami's 45:07; no winner has had less since 1999.
- Playoffs: the Carolina Panthers held the ball 42:45 in a 23-0 Wild Card win at the New York Giants on January 8, 2006.
NFL plays per game and seconds per play by season
The league has slowed down. Both teams together ran 130.1 offensive plays a game in 2013, the most since 1999, at 27.9 seconds of possession per play. In 2025 they ran 122.5, the fewest, at 29.6 seconds, the slowest. Scoring did not fall with it: teams averaged 23.0 points a game in 2025, the fourth-highest mark of the period.
The possession winner's win rate has ranged from 61.5 percent in 1999 to 74.0 percent in 2000.
| Season | Plays per game | Seconds per play | More possession won |
|---|---|---|---|
| 1999 | 125.7 | 28.8 | 61.5% |
| 2000 | 124.2 | 29.1 | 74.0% |
| 2001 | 125.2 | 28.9 | 70.2% |
| 2002 | 127.2 | 28.6 | 71.3% |
| 2003 | 125.4 | 29.0 | 68.6% |
| 2004 | 124.9 | 29.0 | 65.9% |
| 2005 | 125.1 | 29.0 | 67.8% |
| 2006 | 125.0 | 28.9 | 69.7% |
| 2007 | 125.5 | 28.9 | 66.3% |
| 2008 | 123.8 | 29.3 | 68.4% |
| 2009 | 125.9 | 28.8 | 69.3% |
| 2010 | 126.2 | 28.8 | 68.0% |
| 2011 | 127.3 | 28.4 | 69.3% |
| 2012 | 128.5 | 28.3 | 64.6% |
| 2013 | 130.1 | 27.9 | 65.7% |
| 2014 | 128.0 | 28.2 | 68.3% |
| 2015 | 128.8 | 28.2 | 65.1% |
| 2016 | 127.9 | 28.4 | 63.5% |
| 2017 | 126.7 | 28.6 | 72.7% |
| 2018 | 125.9 | 28.8 | 66.0% |
| 2019 | 127.0 | 28.4 | 66.3% |
| 2020 | 128.7 | 28.1 | 64.1% |
| 2021 | 126.7 | 28.7 | 69.9% |
| 2022 | 126.0 | 28.8 | 65.6% |
| 2023 | 126.2 | 28.7 | 62.9% |
| 2024 | 124.3 | 29.1 | 62.4% |
| 2025 | 122.5 | 29.6 | 66.4% |
| 2026 (Weeks 1-5) | 124.1 | 29.3 | 61.4% |
Time of possession in the 2026 NFL season
Through Week 5, all 79 games finished by the Buffalo Bills' 37-34 win at the Los Angeles Rams on Monday, October 12, the team with more possession is 48-30-1, 61 percent, and the team with more first-half possession is 45-33-1. Games are averaging 124.1 offensive plays at 29.3 seconds each, against 122.4 and 29.6 over the first five weeks of 2025.
- Most possession: the Chicago Bears, 35:12 a game at 3-2; the New York Giants, 34:02 at 3-1-1; and the Minnesota Vikings, 33:38 and one of two teams at 5-0.
- Least: the Tennessee Titans, 24:31 a game and 0-5.
- Winning without it: the San Francisco 49ers are 5-0 with 28:36 a game, 25th in the league, and the Bills are 4-1 at 28:31, 27th; the Kansas City Chiefs, 4-0, are at 30:10.
The NFL schedule has every remaining game, and the Vertize NFL simulator plays out the rest of the season from the real standings.
Does time of possession matter in the NFL: frequently asked questions
How often does the team with more time of possession win in the NFL? About 67 percent of the time in the regular season from 1999 to 2025, and 82 percent when the edge is 10 minutes or more.
Does time of possession cause wins? Mostly it follows them. The first-half possession leader wins 58 percent of the time, and in games tied at halftime it wins 49 percent.
What is the record for time of possession in an NFL game? Since 1999, 47:49, by the Pittsburgh Steelers in a 43-0 win at Cleveland in 1999. The least in a win is 14:53, by the 2009 Indianapolis Colts at Miami.
Who leads the NFL in time of possession in 2026? The Chicago Bears, at 35:12 a game through Week 5.
How this was built: time of possession is the sum of each team's drive times in nflverse's play-by-play (2026 file updated October 13), overtime included unless a figure says regulation; first-half possession counts drives that began in the first or second quarter. Results and game types come from the nflverse games file, refreshed on October 13, 2026, and 2026 records were checked against NFL.com's standings. The period is the 1999 to 2025 regular seasons and playoffs, plus 2026 through Week 5. Games are kept when the regulation drive times add up to 60 minutes and the first half to 30, within 10 seconds: three regular-season games without play-by-play and 24 with incomplete drive data are left out, along with the 54 team seasons they belong to. Plays are runs, passes, sacks, kneel-downs and spikes, without two-point tries or plays wiped out by penalties. Ties count as half a win.