We counted all 6,967 regular-season games from 1999 to 2025 in nflverse's game results, plus the 49 games of 2026 played through Thursday, October 1. Points per game here means per team, so a typical game has about twice that on the scoreboard. To split points into touchdowns, field goals and extra points we used nflverse's team game stats and kept only team games whose scoring plays add up exactly to the final score.
NFL scoring by year: points per game since 1999
Across the 27 full seasons, teams averaged 22.1 points a game. Six of the first eight seasons stayed under 21, and every season since 2007 has been above 21.4. The five highest are 2020 at 24.8, 2013 at 23.4, 2018 at 23.3, 2025 at 23.0 and 2021 at 23.0.
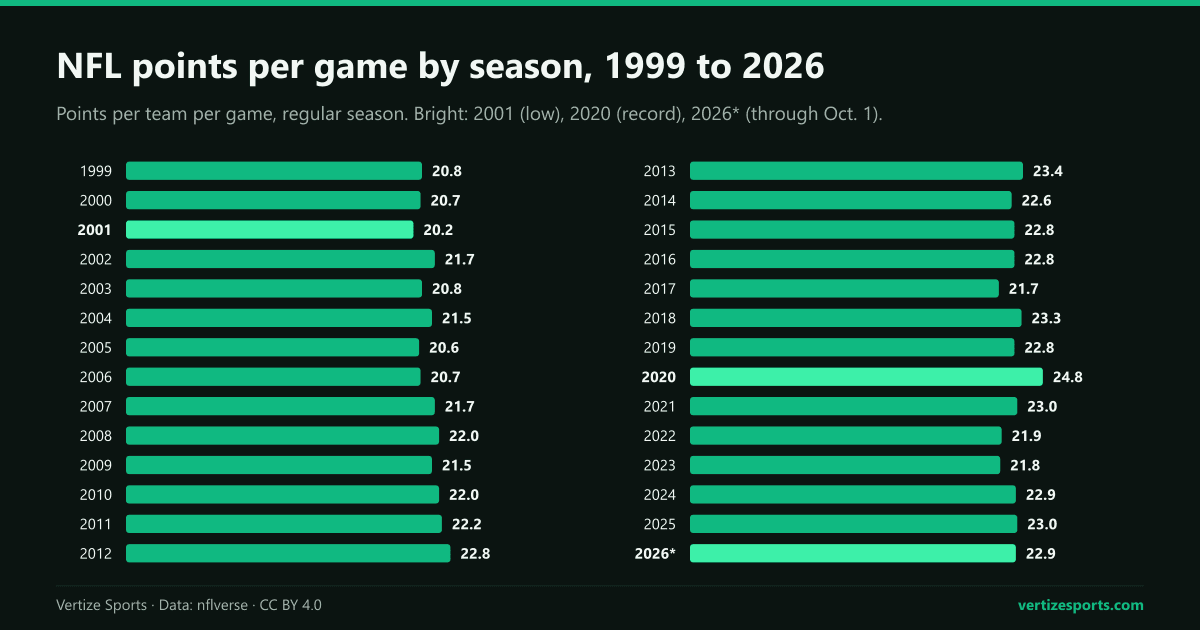
The range is narrow: the gap between the lowest and highest season is 40.4 to 49.6 points for both teams together, about one touchdown and one field goal a game.
The highest scoring NFL season and the lowest since 1999
The 2020 season set the records. NFL.com counted 12,692 points, the first season over 12,000, and our count matches it exactly, as it matches the 11,985 of 2013, the previous high. ProFootballTalk noted that the previous record pace per team was 23.6 points a game, set in 1948.
- 2020: 2.88 touchdowns per team game, 1.70 passing and 1.04 rushing, all three the most since 1999; touchdowns produced 69.6 percent of points, also a high.
- 2020: 33.4 percent of team games reached 30 points, and five teams averaged 30 or more, the most of any season in our data.
- 2001: 20.2 points and 2.26 touchdowns per team game, both the lowest; kickers made 76.8 percent of field goals and 16.9 percent of team games reached 30.
- Next-lowest seasons: 2005 at 20.6, 2006 and 2000 at 20.7 each.
- Best team since 1999: the 2013 Denver Broncos, 37.9 points a game, ahead of the 2007 New England Patriots at 36.8.
Touchdowns vs field goals: where NFL points come from
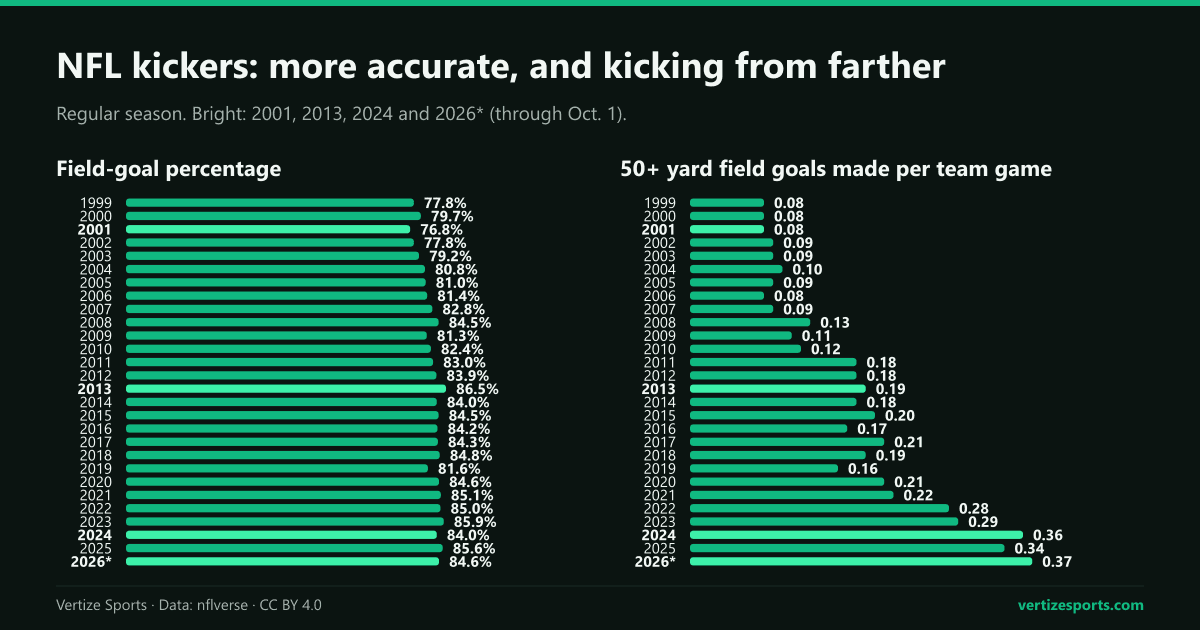
The mix has barely moved. In every season since 1999, touchdowns (six points each, before the try) produced between 66.0 and 69.6 percent of all points, and field goals between 19.2 and 23.4 percent. What changed is how well and from how far teams kick.
- Accuracy: 76.8 percent of field goals were good in 2001, a record 86.5 percent in 2013 and 85.6 percent in 2025. Every season since 2004 has been above 80 percent.
- Range: teams made 0.08 field goals of 50 yards or more per game in 2000 and 0.36 in 2024, more than four times as many, from 0.13 attempts to 0.50.
- Volume: field-goal attempts went from 1.70 per team game in 2004 to 2.05 in 2024, and makes from 1.37 to 1.72.
Passing carries the touchdown side. Passing touchdowns per team game ranged from 1.26 in 2005 to 1.70 in 2020 and stood at 1.49 in 2025, against 0.94 rushing. Touchdowns other than passing and rushing (kick and punt returns, defensive scores, fumble recoveries) have faded, from 0.27 per team game in 2012 to 0.14 in 2025, and so have giveaways: 1.78 turnovers per team game in 1999, 1.09 in 2025, the fewest of the period, with interceptions down from 1.13 to 0.70.
NFL rule changes and scoring
Five rule changes since 1999 show up clearly in the numbers they were meant to move. Their effect on total points is smaller and mixed, as the table shows.
| Season | Change | Measure | Before | After | Points before | Points after |
|---|---|---|---|---|---|---|
| 2004 | Illegal contact a point of emphasis | Net yards per pass play | 5.83 | 6.14 | 20.8 | 21.5 |
| 2011 | Kickoffs moved to the 35 | Kickoff returns per team game | 3.97 | 2.68 | 22.0 | 22.2 |
| 2015 | Extra point snapped from the 15 | Extra points made | 99.3% | 94.2% | 22.6 | 22.8 |
| 2024 | Dynamic kickoff | Kickoff returns per team game | 1.08 | 1.69 | 21.8 | 22.9 |
| 2025 | Touchbacks on kickoffs to the 35 | Kickoff returns per team game | 1.69 | 3.82 | 22.9 | 23.0 |
- 2004: the competition committee made the illegal contact rule, which allows a defender only incidental contact with a receiver more than five yards downfield, a point of emphasis. Net yards per pass play, counting sacks, rose from 5.83, the lowest of the period, to 6.14, and scoring from 20.8 to 21.5, but 2005 fell back to 20.6.
- 2011: owners moved kickoffs to the 35-yard line for player safety, with touchbacks still at the 20. Kickoff returns fell from 3.97 per team game to 2.68.
- 2015: the extra point was snapped from the 15-yard line with two-point tries left at the 2. Kickers made 99.3 percent of extra points in 2014 and 94.2 percent in 2015, and every season since has been under 96 percent; two-point conversions rose from 0.05 to 0.09 per team game.
- 2024 and 2025: the dynamic kickoff began as a one-year trial in 2024, and in 2025 owners made it permanent and moved touchbacks on kicks into the end zone to the 35. Kickoff returns went from 1.08 per team game in 2023, the fewest of the period, to 1.69 in 2024 and 3.82 in 2025, the most since 2010.
Scoring rose from 21.8 in 2023 to 22.9 and 23.0 after the kickoff change, but kicking range and a record low in turnovers moved in the same years, so the kickoff alone cannot be credited.
NFL scoring in 2026 so far
Through Week 3 and the Week 4 Thursday game, the Cleveland Browns' 27-24 win over the Pittsburgh Steelers on October 1, teams are scoring 22.9 points a game, just under the 23.0 of 2025. The first three weeks of 2025 also averaged 22.9, and in 17 of the 27 seasons since 1999 the first three weeks scored less than the full season; the gap averaged 0.7 points either way and reached 2.2 in 2004.
- 30-point games: 31.6 percent of team games so far, against 25.0 percent in 2025 and the record 33.4 percent of 2020.
- Long field goals: 0.37 made from 50 yards or more per team game, on 0.55 attempts, ahead of the 2024 record of 0.36; overall accuracy is 84.6 percent.
- Kickoffs: 3.99 returns per team game, about the 2025 level of 3.82.
- Touchdowns: 1.65 passing and 0.83 rushing per team game, after 1.49 and 0.94 in 2025.
- Highest-scoring game: the Chicago Bears' 59-37 win over the Carolina Panthers in Week 1, 96 points, the fifth-highest total of the 7,016 regular-season games since 1999.
- Teams: the Buffalo Bills lead at 33.7 points a game and the San Francisco 49ers are next at 32.7, both after three games; the Miami Dolphins and New England Patriots are at 12.0.
Every remaining game is on the NFL schedule, and the Vertize NFL simulator lets you pick the results and play out the season. With scoring at this level, about half of all games are still decided by one score, as our study of NFL one-score games shows.
For comparison, NBA teams scored 115.6 points a game in 2025-26, the most in 30 seasons, in NBA points per game by season; MLB teams scored 4.48 runs per game in 2026 in MLB runs per game by season; and NHL games averaged 6.16 goals in 2025-26 in NHL goals per game by season.
NFL points per game by season: the full table
| Season | Points | TDs | FGs made | FG% | XP% | Share from TDs |
|---|---|---|---|---|---|---|
| 2026* | 22.9 | 2.56 | 1.68 | 84.6% | 95.7% | 67.1% |
| 2025 | 23.0 | 2.56 | 1.71 | 85.6% | 95.9% | 66.9% |
| 2024 | 22.9 | 2.55 | 1.72 | 84.0% | 95.8% | 66.8% |
| 2023 | 21.8 | 2.39 | 1.67 | 85.9% | 95.9% | 66.0% |
| 2022 | 21.9 | 2.43 | 1.67 | 85.0% | 94.6% | 66.5% |
| 2021 | 23.0 | 2.62 | 1.61 | 85.1% | 93.4% | 68.3% |
| 2020 | 24.8 | 2.88 | 1.59 | 84.6% | 93.0% | 69.6% |
| 2019 | 22.8 | 2.60 | 1.57 | 81.6% | 93.9% | 68.4% |
| 2018 | 23.3 | 2.68 | 1.57 | 84.8% | 94.3% | 68.8% |
| 2017 | 21.7 | 2.39 | 1.69 | 84.3% | 94.0% | 66.1% |
| 2016 | 22.8 | 2.55 | 1.66 | 84.2% | 93.6% | 67.2% |
| 2015 | 22.8 | 2.57 | 1.63 | 84.5% | 94.2% | 67.7% |
| 2014 | 22.6 | 2.53 | 1.62 | 84.0% | 99.3% | 67.1% |
| 2013 | 23.4 | 2.61 | 1.69 | 86.5% | 99.6% | 67.0% |
| 2012 | 22.8 | 2.53 | 1.66 | 83.9% | 99.5% | 66.8% |
| 2011 | 22.2 | 2.46 | 1.64 | 83.0% | 99.4% | 66.5% |
| 2010 | 22.0 | 2.48 | 1.55 | 82.4% | 99.1% | 67.5% |
| 2009 | 21.5 | 2.44 | 1.48 | 81.3% | 98.3% | 68.1% |
| 2008 | 22.0 | 2.43 | 1.65 | 84.5% | 99.5% | 66.3% |
| 2007 | 21.7 | 2.43 | 1.55 | 82.8% | 98.9% | 67.2% |
| 2006 | 20.7 | 2.31 | 1.50 | 81.4% | 99.0% | 67.0% |
| 2005 | 20.6 | 2.29 | 1.53 | 81.0% | 98.7% | 66.6% |
| 2004 | 21.5 | 2.48 | 1.37 | 80.8% | 99.2% | 69.2% |
| 2003 | 20.8 | 2.34 | 1.48 | 79.2% | 98.4% | 67.4% |
| 2002 | 21.7 | 2.48 | 1.44 | 77.8% | 98.5% | 68.7% |
| 2001 | 20.2 | 2.26 | 1.48 | 76.8% | 98.1% | 67.0% |
| 2000 | 20.7 | 2.32 | 1.48 | 79.7% | 99.1% | 67.3% |
| 1999 | 20.8 | 2.33 | 1.51 | 77.8% | 98.9% | 67.0% |
NFL points per game: frequently asked questions
What is the average points per game in the NFL? In the 2025 regular season, 23.0 per team, or about 46 for both teams together. Across every season from 1999 to 2025 it is 22.1 per team.
What was the highest scoring NFL season? 2020, at 24.8 points per team per game and 12,692 points in all, the most in league history. The highest since then is 2025, at 23.0.
What was the lowest scoring NFL season since 1999? 2001, at 20.2 points per team per game, followed by 2005 at 20.6.
Are NFL kickers getting better? Yes. Field-goal accuracy rose from 76.8 percent in 2001 to a high of 86.5 percent in 2013 and was 85.6 percent in 2025, while made field goals of 50 yards or more per team game went from 0.08 in 2000 to 0.36 in 2024.
How is NFL scoring in 2026? Through October 1, teams average 22.9 points a game, close to the 23.0 of 2025, with more 30-point games and more 50-yard field goals.
How this was built: final scores of every regular-season game from 1999 to 2025 and of the 2026 games played through October 1 (7,016 games) from nflverse's games file, downloaded on October 3, 2026; playoffs are excluded and overtime points are included. Points are per team per game. The 2022 Buffalo-Cincinnati game, never completed, is not in the data. Touchdowns, field goals, extra points, two-point conversions, kickoff returns, passing and turnovers come from nflverse's weekly team stats; we rebuilt each team's score from its scoring plays and left out 40 of 14,032 team games where the stats were missing or did not add up, most of them in 1999 to 2002. Our season point totals match NFL.com's for 2013 and 2020, and our 2026 Week 1 to 3 scores match NFL.com's schedule pages. Net yards per pass play: passing yards minus sack yards, over attempts plus sacks. Rule changes are dated from NFL.com and ESPN reports.