We took every regular-season game from 1999 to 2025, 6,964 of them, with the team box scores in nflverse's team stats and the final scores in its games file. A team's giveaways are its interceptions thrown plus its fumbles lost, on any play; its takeaways are the opponent's giveaways, so the two margins in a game always add up to zero. Then we added the margins up by season, compared them with wins and playoff berths, and followed every team into the next season.
How often the team that wins the turnover battle wins
Each turnover of margin moves the odds a long way. At plus 1 a team won 68 percent of its games, at plus 2 it won 84 percent and at plus 3 or better 92 percent. The losing side is the mirror image. Turnovers were even in 1,455 games, 21 percent, and those split exactly 50-50.
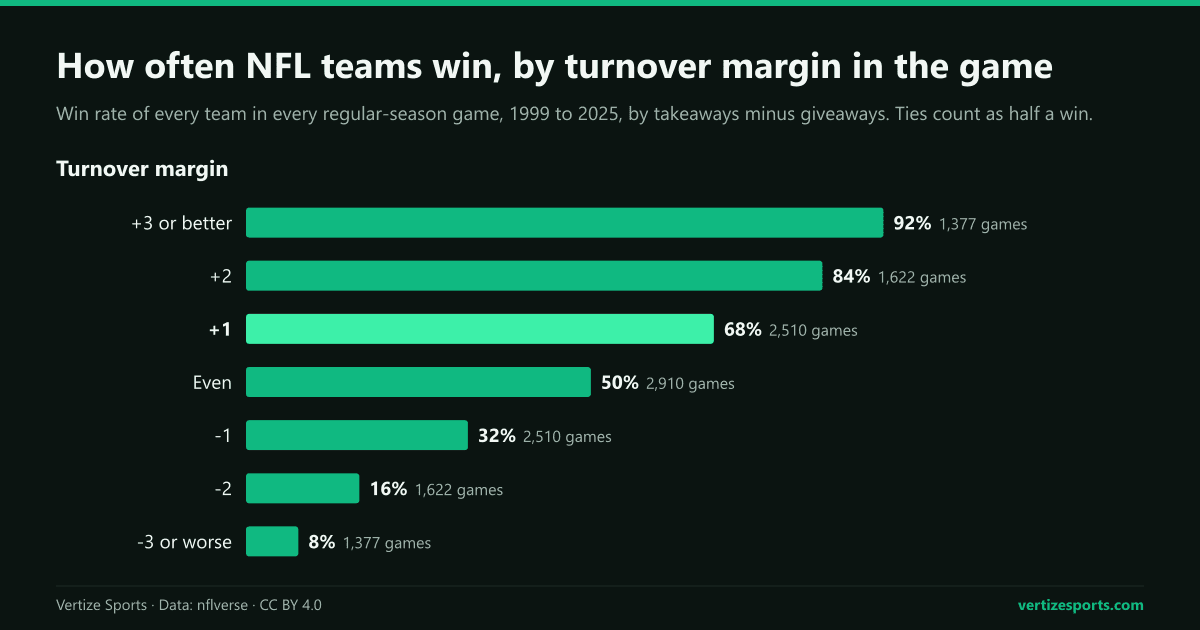
| Turnover margin | Team games | Won-lost-tied | Win rate | Average point margin |
|---|---|---|---|---|
| +3 or better | 1,377 | 1,271-103-3 | 92.4% | +15.0 |
| +2 | 1,622 | 1,355-266-1 | 83.6% | +9.9 |
| +1 | 2,510 | 1,698-803-9 | 67.8% | +5.0 |
| Even | 2,910 | 1,453-1,453-4 | 50.0% | +0.0 |
| -1 | 2,510 | 803-1,698-9 | 32.2% | -5.0 |
| -2 | 1,622 | 266-1,355-1 | 16.4% | -9.9 |
| -3 or worse | 1,377 | 103-1,271-3 | 7.6% | -15.0 |
In points, the average team at plus 1 outscored its opponent by 5.0, at plus 2 by 9.9 and at plus 3 or better by 15.0; a least-squares fit across all games puts each turnover of margin at about 4.5 points. Part of that is the turnover itself, which ends a drive and often sets up a short field; part is that teams that fall behind throw more, and riskier, passes.
- Plus 4 or better: 518 team games, 500 wins, 17 losses and one tie. The biggest edge in a loss: the 2000 Cleveland Browns, plus 6 and beaten 24-10 by the Tennessee Titans.
- The biggest margin: plus 7, six times. The 2012 Seattle Seahawks took the ball away eight times and gave it up once in a 58-0 win over the Arizona Cardinals in Week 14.
- Even: turnovers decide nothing on their own when they cancel out; the 1,455 even games produced 1,453 wins for each side and four ties.
Turnover differential, wins and playoff berths
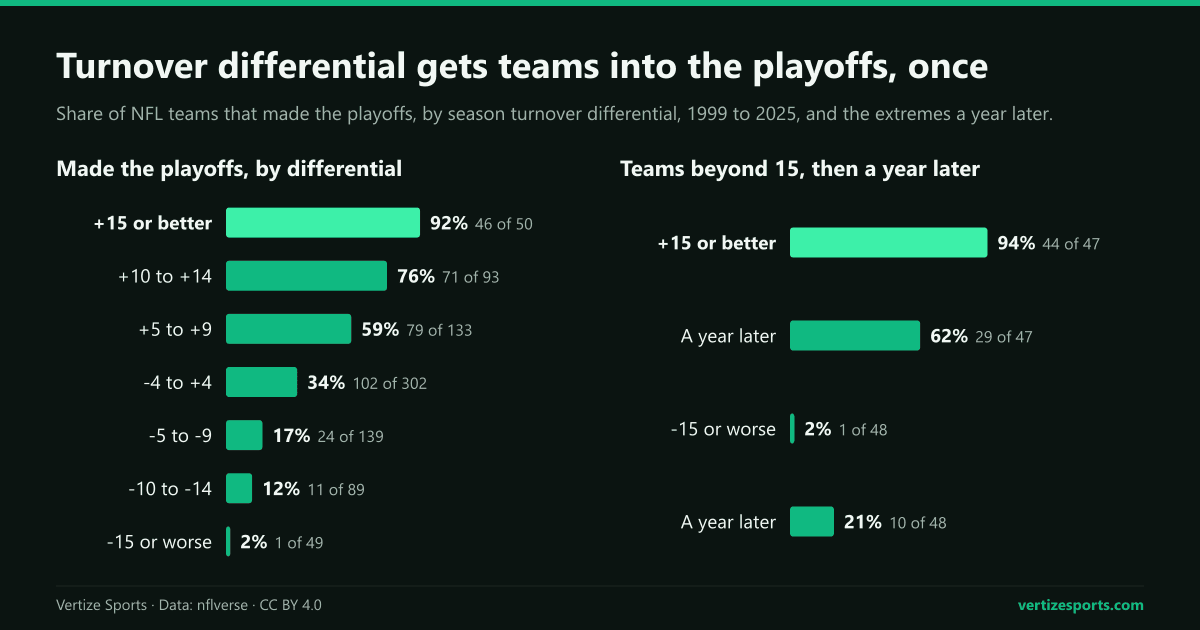
Over a season, turnover differential tracks winning closely. Across 855 complete team seasons the correlation between differential and win rate was 0.65, below point differential at 0.91 but strong for a single statistic. Teams at plus 15 or better won 73 percent of their games, about 12 wins in a 17-game season, and 46 of 50 made the playoffs. At minus 15 or worse, one team in 49 did: the 2004 St. Louis Rams, 8-8 with a differential of minus 24.
| Season differential | Team seasons | Win rate | Wins per 17 games | Made playoffs |
|---|---|---|---|---|
| +15 or better | 50 | 73% | 12.3 | 46 (92%) |
| +10 to +14 | 93 | 67% | 11.4 | 71 (76%) |
| +5 to +9 | 133 | 61% | 10.3 | 79 (59%) |
| -4 to +4 | 302 | 49% | 8.3 | 102 (34%) |
| -5 to -9 | 139 | 39% | 6.7 | 24 (17%) |
| -10 to -14 | 89 | 37% | 6.3 | 11 (12%) |
| -15 or worse | 49 | 26% | 4.4 | 1 (2%) |
A positive differential is close to the line between in and out: 248 of 407 teams with one made the playoffs, 61 percent, against 69 of 406 with a negative one, 17 percent. It is not a requirement for a title either. Of the 26 Super Bowl champions since 2000, 21 finished the regular season in plus territory, but five did not: the 2007 New York Giants at minus 9, the 2015 Denver Broncos, the 2022 and 2023 Kansas City Chiefs, minus 11 in the second of those seasons, and last season's Seattle Seahawks at minus 3.
The extremes since 1999 are a pair of plus 28s, by the 2010 New England Patriots and the 2011 San Francisco 49ers, both with 38 takeaways and 10 giveaways, and the minus 28 of the 2017 Cleveland Browns, who went 0-16. The 2025 Chicago Bears finished plus 22 with 33 takeaways and 11 giveaways, the first time they led the NFL since 1985, and the 2025 New York Jets took the ball away four times all season, the fewest by any team in our data, without a single interception, a first in NFL history.
Is turnover differential luck? What happens the next season
Mostly it does not repeat. The correlation between a team's turnover differential per game in one season and the next was 0.14 over 819 pairs of seasons, against 0.41 for point differential and 0.33 for win rate. Takeaways and giveaways taken separately carry over more, at 0.32 and 0.35, but the two drift back toward the league average at the same time, and the differential between them is what washes out.
The 47 teams that finished at plus 15 or better averaged plus 18.6, and plus 4.1 the next year: their takeaways fell from 36.7 to 27.3 and their giveaways rose from 18.0 to 23.2. Thirty-five of them won a smaller share of their games, and the number that made the playoffs fell from 44 to 29. The 48 teams at minus 15 or worse went from minus 18.6 to plus 0.6 on average, 39 of them improved their record, and 10 made the playoffs.
- Every league leader fell back: all 30 teams that led or shared the lead in a season from 1999 to 2024 had a smaller differential the next year, and 10 of them went negative. The 2006 Baltimore Ravens went from plus 17 and 13-3 to minus 17 and 5-11.
- The best follow-up was the 2010 Patriots' plus 17 in 2011, after their plus 28.
- Every last-place team improved: all 32 teams with the worst differential, from 1999 to 2024, did better the next season. The 2012 Philadelphia Eagles and the 2015 Dallas Cowboys went from last in their division to division champions; how common that jump is, we counted in our study of worst-to-first teams.
| Season | League leader | Differential | Record | Next season | Next record | Playoffs next season |
|---|---|---|---|---|---|---|
| 2014 | Green Bay Packers | +14 | 12-4 | +5 | 10-6 | Yes |
| 2015 | Carolina Panthers | +20 | 15-1 | -2 | 6-10 | No |
| 2016 | Kansas City Chiefs | +16 | 12-4 | +15 | 10-6 | Yes |
| 2016 | Oakland Raiders | +16 | 12-4 | -14 | 6-10 | No |
| 2017 | Baltimore Ravens | +17 | 9-7 | -3 | 10-6 | Yes |
| 2018 | Seattle Seahawks | +15 | 10-6 | +12 | 11-5 | Yes |
| 2019 | New England Patriots | +21 | 12-4 | +3 | 7-9 | No |
| 2020 | Tennessee Titans | +11 | 11-5 | -3 | 12-5 | Yes |
| 2021 | Dallas Cowboys | +14 | 12-5 | +10 | 12-5 | Yes |
| 2021 | Indianapolis Colts | +14 | 9-8 | -13 | 4-12-1 | No |
| 2022 | San Francisco 49ers | +13 | 13-4 | +10 | 12-5 | Yes |
| 2023 | Baltimore Ravens | +12 | 13-4 | +6 | 12-5 | Yes |
| 2023 | New York Giants | +12 | 6-11 | -8 | 3-14 | No |
| 2024 | Buffalo Bills | +24 | 13-4 | +1 | 12-5 | Yes |
| 2025 | Chicago Bears | +22 | 11-6 | -4 (5 games) | 3-2 | To be decided |
NFL turnover differential leaders in 2026
Through the 78 games finished by Sunday, October 11, the Minnesota Vikings lead the league at plus 6, with 10 takeaways and four giveaways, and they are one of two teams at 5-0, with the 49ers, who are plus 2. The Buffalo Bills and the Los Angeles Rams, who met on Monday night, are counted through Week 4.
- Plus 5: the Jacksonville Jaguars, 4-1; the Kansas City Chiefs, 4-0; and the Washington Commanders, 1-3-1, a reminder that the margin does not settle every game.
- Minus 6: the Indianapolis Colts, 2-3, and the New Orleans Saints, 1-4.
- Minus 5: the Los Angeles Chargers and the Tennessee Titans, both 0-5, the Atlanta Falcons, the Rams and the New England Patriots, who are 3-2.
- Last year's extremes: the Bears, plus 22 in 2025, are minus 4 at 3-2. The Houston Texans, second at plus 17, are plus 3 and 1-4. The Jets, minus 19, are plus 3.
The single-game pattern has held this season: teams that won the turnover battle are 46-10-1. How much five games say about a season, at either end of the table, is the subject of our look at 0-3 starts. The full schedule has every remaining game, and the Vertize NFL simulator plays out the rest of the season from the real standings.
NFL turnover differential: frequently asked questions
How often does the team that wins the turnover battle win in the NFL? About 79 percent of the time in the regular season from 1999 to 2025: 4,324 wins, 1,172 losses and 13 ties in 5,509 games where one team had more takeaways.
How many points is a turnover worth? About 4.5 points of final margin per turnover of differential in a game, by a least-squares fit across 6,964 regular-season games.
What is the best turnover differential in NFL history? Since 1999, plus 28, by the 2010 New England Patriots and the 2011 San Francisco 49ers. The worst in that span is minus 28, by the 0-16 Cleveland Browns of 2017.
Is turnover differential sustainable? Rarely. From one season to the next its correlation is 0.14, and all 30 league leaders from 1999 to 2024 had a smaller differential the following year.
Who leads the NFL in turnover differential in 2026? The Minnesota Vikings, plus 6 through Week 5, ahead of the Jaguars, Chiefs and Commanders at plus 5.
How this was built: every regular-season game of the 1999 to 2025 seasons and of 2026 through Sunday, October 11, from nflverse's team stats (downloaded on October 13, 2026, file updated October 12) and games file; 2026 records checked against NFL.com's standings. Giveaways are interceptions thrown plus fumbles lost, including on special teams; takeaways are the opponent's giveaways. Three games have no team stats in nflverse (Baltimore at St. Louis in 1999, San Diego at Kansas City and Buffalo at Miami in 2000) and are left out, along with the six team seasons they belong to; Jacksonville's 16 home games of 2001 and 2002 lack a Jaguars row, so its giveaways come from the opponent's interceptions and fumble recoveries, a method that matches the real count in 99.5 percent of games where both rows exist. Win rates count ties as half a win. Playoff berths come from the playoff games in the same file.