Three clubs come up from the Championship each summer, the top two automatically and a third through the play-offs, and three go down. The exception was 1995, when the league shrank from 22 clubs to 20 and only two were promoted. We rebuilt the final table of every Premier League season since then from the match results published by football-data.co.uk, and the second-tier table of the season before each promotion, to follow every club that came up: how it got there, where it finished and how long it lasted.
How often promoted teams stay up in the Premier League
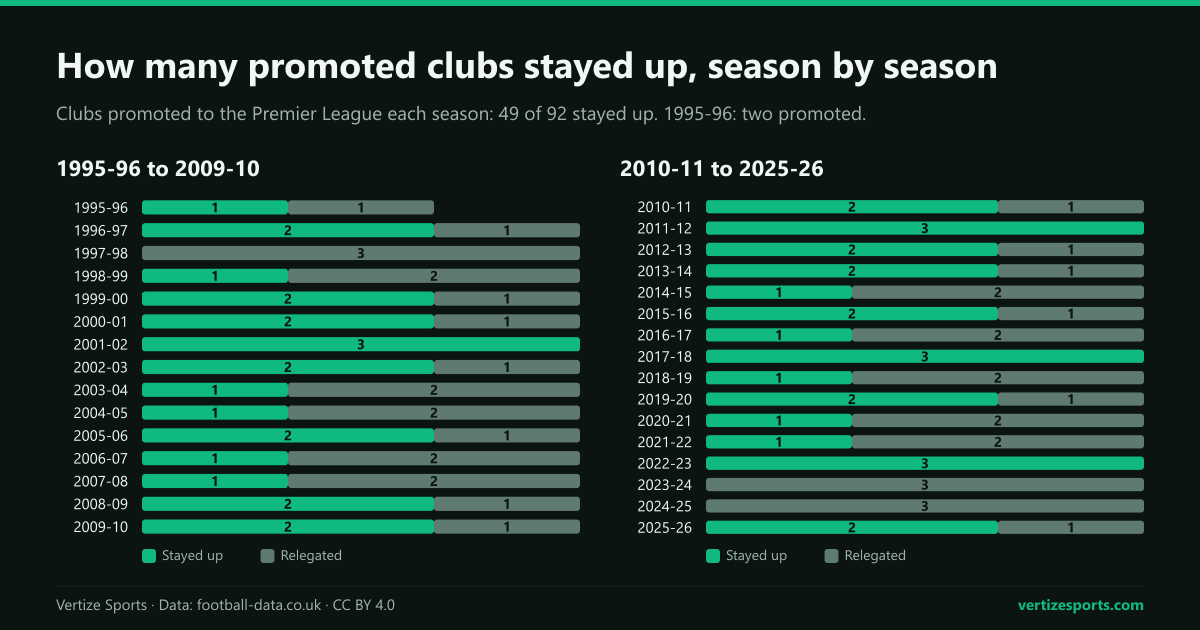
Two of the three surviving is the most common outcome: it happened in 13 of the 30 seasons with three promoted clubs. One survivor happened ten times, all three stayed up four times and all three went down three times.
Seen from the bottom of the table, promoted clubs have filled 43 of the 93 relegation places since 1995-96, 46 percent. In 27 of the 31 seasons, at least one of the clubs going down had come up the summer before.
Survival by route: champions, runners-up and play-off winners
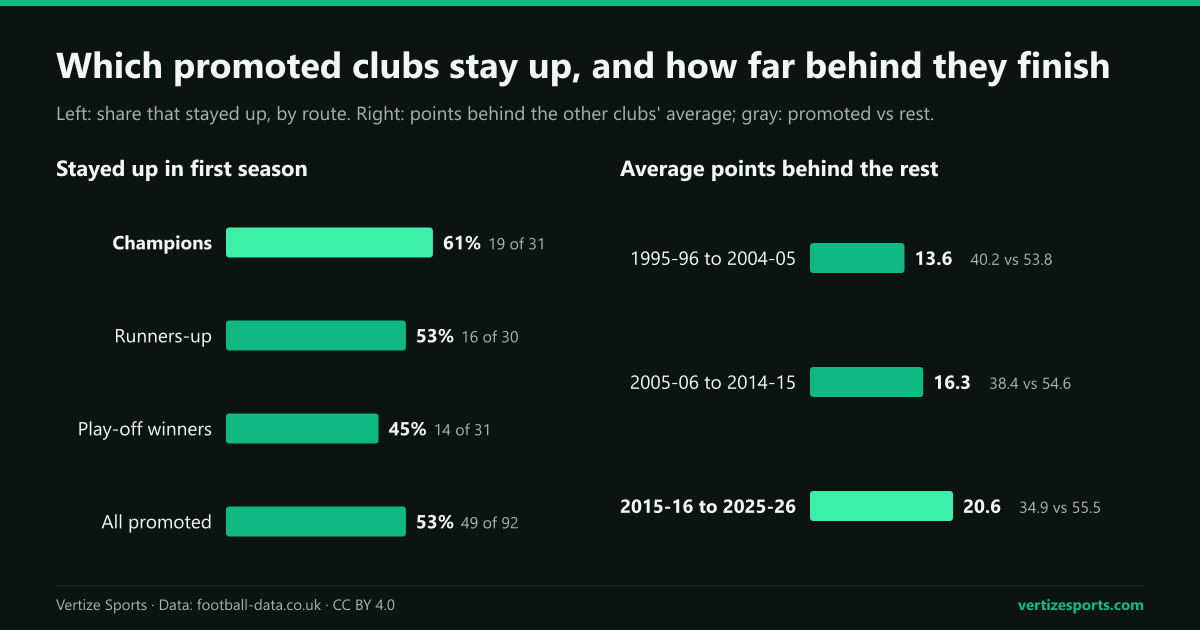
The route up matters, if not by much. Champions stayed up 19 times in 31, or 61 percent, runners-up 16 times in 30 and play-off winners 14 times in 31, 45 percent. Champions arrive with far more points, 94.2 on average in the second tier against 79.5 for play-off winners, but a season later the difference has shrunk to 3.4: champions averaged 39.7 Premier League points in their first season, runners-up 37.1 and play-off winners 36.3.
| Route up | Promoted | Stayed up | Share | Avg. points | Lasted 3 seasons |
|---|---|---|---|---|---|
| Second-tier champions | 31 | 19 | 61% | 39.7 | 13 of 29 |
| Runners-up | 30 | 16 | 53% | 37.1 | 10 of 28 |
| Play-off winners | 31 | 14 | 45% | 36.3 | 10 of 29 |
| All promoted clubs | 92 | 49 | 53% | 37.7 | 33 of 86 |
The size of a promotion says little about what follows. Across all 92 clubs, the points a club took in the second tier and the points it took the next season have a correlation of 0.06, close to none. Reading won the 2005-06 Championship with 106 points, the most of any promoted club, and finished eighth. Burnley took 101 points in 2022-23 and 100 in 2024-25, and went straight back down both times, with 24 and then 22.
The play-off route has also just widened: from this season the Championship play-offs take the clubs from third to eighth instead of third to sixth, so the third promoted club can come from further down the Championship table. What those places cost is in our look at promotion points in four second tiers.
When all three promoted teams were relegated
It has happened three times, twice in the last three seasons:
- 1997-98: Bolton Wanderers (18th, 40 points), Barnsley (19th, 35) and Crystal Palace (20th, 33).
- 2023-24: Luton Town (18th, 26), Burnley (19th, 24) and Sheffield United (20th, 16).
- 2024-25: Leicester City (18th, 25), Ipswich Town (19th, 22) and Southampton (20th, 12).
In 1997-98 all three finished within seven points of safety, and Bolton went down level on 40 points with Everton, on goal difference. The last two times they were nowhere near it: the six clubs averaged 20.8 points, and Luton's 26 and Leicester's 25 are the two lowest totals ever to finish 18th.
All three promoted clubs have stayed up four times: Fulham, Blackburn Rovers and Bolton Wanderers in 2001-02; Queens Park Rangers, Norwich City and Swansea City in 2011-12; Newcastle United, Brighton & Hove Albion and Huddersfield Town in 2017-18; and Fulham, AFC Bournemouth and Nottingham Forest in 2022-23.
Promoted teams relegated: a widening gap with the rest
In points, the promoted clubs have fallen further behind in every decade. They averaged 40.2 points in the first ten seasons of the 20-club league, 38.4 in the next ten and 34.9 in the last eleven, while the other clubs' average rose from 53.8 to 54.6 to 55.5. The gap between the two grew from 13.6 points a season to 16.3 and then 20.6.
The two widest single-season gaps are the last two all-down seasons: the promoted clubs finished 35.6 points behind the average of the other 17 in 2023-24 and 38.5 behind in 2024-25.
Survival rates have not fallen in step, because the bar has come down with them. Promoted clubs stayed up 52 percent of the time in the first decade, 60 percent in the second and 48 percent in the last eleven seasons, while the team in 18th averaged 36.5, 35.1 and then 32.6 points, as our analysis of the points it takes to stay up found. Promoted clubs took 17 of the last 33 relegation places and seven of the last nine, so the line they have to clear has dropped toward them.
Last season broke the pattern. Sunderland, promoted through the play-offs, finished seventh with 54 points and Leeds United, the champions, 14th with 47. Of the three, only Burnley went down, with 22.
The best promoted team in Premier League history
In the 20-club era the benchmark is Ipswich Town in 2000-01: promoted through the play-offs, they finished fifth with 66 points, a total no promoted club has matched since. The five best finishes by promoted clubs:
- Ipswich Town, 2000-01: 5th, 66 points.
- Sunderland, 1999-2000: 7th, 58 points.
- Wolverhampton Wanderers, 2018-19: 7th, 57 points.
- Sunderland, 2025-26: 7th, 54 points.
- Reading, 2006-07: 8th, 55 points.
Leeds United's 59 points for ninth place in 2020-21 are the second-highest total by a promoted club, one more than Sunderland's 58 in 1999-2000.
Before the league was cut to 20 clubs, two promoted sides did better still: Newcastle United in 1993-94 and Nottingham Forest in 1994-95 both finished third with 77 points, in 42-game seasons. At the other end, Derby County took 11 points in 2007-08, the fewest by any club in a Premier League season, and Southampton 12 in 2024-25. Both had come up through the play-offs.
Second-season syndrome: the second and third seasons
Surviving the first season is most of the battle. Of the 47 clubs that stayed up and have since played a second season, 36 survived that too, 77 percent, and 33 of those 36 lasted a third. Counting every promotion up to 2023, 33 of 86, or 38 percent, stayed up for at least three seasons.
Some of the best first seasons were followed by a fall. Ipswich went from fifth to 18th in 2001-02, Reading from eighth to 18th in 2007-08, Birmingham City from ninth to 18th in 2010-11 and Sheffield United from ninth to 20th in 2020-21. Middlesbrough, 12th in 1995-96, went down the next season after being docked three points for calling off a game against Blackburn Rovers without permission; with those points they would have finished 14th, and Coventry City would have gone down instead.
Once a club settles, it can stay a long time. Eleven of this season's 20 clubs came up in the 20-club era and have not gone down since, led by Manchester City, promoted in 2002, and Crystal Palace, promoted in 2013. With the three new arrivals, 14 of the 20 have come up at least once since 1995-96; only six have been in the league in every season since: Arsenal, Chelsea, Everton, Liverpool, Manchester United and Tottenham Hotspur.
At the other extreme, four clubs have come up five times each: Burnley, Norwich City, Sunderland and West Bromwich Albion. Norwich and Burnley stayed up only once in those five tries.
The 2026-27 promoted clubs so far
This season's three are Coventry City, champions with 95 points and in the top flight for the first time since 2000-01; Ipswich Town, runners-up with 84 points and back after one season away; and Hull City, who finished sixth with 73 and beat Middlesbrough 1-0 in the play-off final at Wembley on 23 May, after Southampton were expelled from the play-offs for filming other clubs' training. Only four promotions in the 20-club era had come from sixth place before Hull's: Crystal Palace in 1997 and 2004, West Ham United in 2005 and Blackpool in 2010. Only West Ham stayed up.
After five matchdays, the Premier League table has Hull eighth with eight points, Ipswich 11th with six and Coventry 18th with three, in the relegation zone. Sky Sports' table shows the same standings as of 30 September, with no games played since 20 September.
Early points have mattered in the past. All 14 promoted clubs since 1995-96 that took eight or more points from their first five games stayed up, Hull among them in 2008-09. Of the 14 that had exactly six, four survived. Of the 22 with three or fewer, three did: West Bromwich Albion in 2004-05, Southampton in 2012-13 and Crystal Palace in 2013-14.
The simulations behind our relegation odds count those points but judge the rest of the season on each squad, rated on last season's finish and its market value. They send Hull down in 97 percent of simulated seasons, Coventry in 86 percent and Ipswich in 61 percent. To play the rest of the season out yourself, put a score on any game still to come in the Premier League simulator.
Premier League promoted teams by season
Every club promoted since 1995-96, by route, with its place and points in its first season up.
| Season | Champion | Runner-up | Play-off winner | Stayed up |
|---|---|---|---|---|
| 2025-26 | Leeds United: 14th, 47 | Burnley: 19th, 22 | Sunderland: 7th, 54 | 2 of 3 |
| 2024-25 | Leicester City: 18th, 25 | Ipswich Town: 19th, 22 | Southampton: 20th, 12 | 0 of 3 |
| 2023-24 | Burnley: 19th, 24 | Sheffield United: 20th, 16 | Luton Town: 18th, 26 | 0 of 3 |
| 2022-23 | Fulham: 10th, 52 | AFC Bournemouth: 15th, 39 | Nottingham Forest: 16th, 38 | 3 of 3 |
| 2021-22 | Norwich City: 20th, 22 | Watford: 19th, 23 | Brentford: 13th, 46 | 1 of 3 |
| 2020-21 | Leeds United: 9th, 59 | West Bromwich Albion: 19th, 26 | Fulham: 18th, 28 | 1 of 3 |
| 2019-20 | Norwich City: 20th, 21 | Sheffield United: 9th, 54 | Aston Villa: 17th, 35 | 2 of 3 |
| 2018-19 | Wolverhampton Wanderers: 7th, 57 | Cardiff City: 18th, 34 | Fulham: 19th, 26 | 1 of 3 |
| 2017-18 | Newcastle United: 10th, 44 | Brighton & Hove Albion: 15th, 40 | Huddersfield Town: 16th, 37 | 3 of 3 |
| 2016-17 | Burnley: 16th, 40 | Middlesbrough: 19th, 28 | Hull City: 18th, 34 | 1 of 3 |
| 2015-16 | AFC Bournemouth: 16th, 42 | Watford: 13th, 45 | Norwich City: 19th, 34 | 2 of 3 |
| 2014-15 | Leicester City: 14th, 41 | Burnley: 19th, 33 | Queens Park Rangers: 20th, 30 | 1 of 3 |
| 2013-14 | Cardiff City: 20th, 30 | Hull City: 16th, 37 | Crystal Palace: 11th, 45 | 2 of 3 |
| 2012-13 | Reading: 19th, 28 | Southampton: 14th, 41 | West Ham United: 10th, 46 | 2 of 3 |
| 2011-12 | Queens Park Rangers: 17th, 37 | Norwich City: 12th, 47 | Swansea City: 11th, 47 | 3 of 3 |
| 2010-11 | Newcastle United: 12th, 46 | West Bromwich Albion: 11th, 47 | Blackpool: 19th, 39 | 2 of 3 |
| 2009-10 | Wolverhampton Wanderers: 15th, 38 | Birmingham City: 9th, 50 | Burnley: 18th, 30 | 2 of 3 |
| 2008-09 | West Bromwich Albion: 20th, 32 | Stoke City: 12th, 45 | Hull City: 17th, 35 | 2 of 3 |
| 2007-08 | Sunderland: 15th, 39 | Birmingham City: 19th, 35 | Derby County: 20th, 11 | 1 of 3 |
| 2006-07 | Reading: 8th, 55 | Sheffield United: 18th, 38 | Watford: 20th, 28 | 1 of 3 |
| 2005-06 | Sunderland: 20th, 15 | Wigan Athletic: 10th, 51 | West Ham United: 9th, 55 | 2 of 3 |
| 2004-05 | Norwich City: 19th, 33 | West Bromwich Albion: 17th, 34 | Crystal Palace: 18th, 33 | 1 of 3 |
| 2003-04 | Portsmouth: 13th, 45 | Leicester City: 18th, 33 | Wolverhampton Wanderers: 20th, 33 | 1 of 3 |
| 2002-03 | Manchester City: 9th, 51 | West Bromwich Albion: 19th, 26 | Birmingham City: 13th, 48 | 2 of 3 |
| 2001-02 | Fulham: 13th, 44 | Blackburn Rovers: 10th, 46 | Bolton Wanderers: 16th, 40 | 3 of 3 |
| 2000-01 | Charlton Athletic: 9th, 52 | Manchester City: 18th, 34 | Ipswich Town: 5th, 66 | 2 of 3 |
| 1999-00 | Sunderland: 7th, 58 | Bradford City: 17th, 36 | Watford: 20th, 24 | 2 of 3 |
| 1998-99 | Nottingham Forest: 20th, 30 | Middlesbrough: 9th, 51 | Charlton Athletic: 18th, 36 | 1 of 3 |
| 1997-98 | Bolton Wanderers: 18th, 40 | Barnsley: 19th, 35 | Crystal Palace: 20th, 33 | 0 of 3 |
| 1996-97 | Sunderland: 18th, 40 | Derby County: 12th, 46 | Leicester City: 9th, 47 | 2 of 3 |
| 1995-96 | Middlesbrough: 12th, 43 | none (one automatic place) | Bolton Wanderers: 20th, 29 | 1 of 2 |
Promoted teams in the Premier League: frequently asked questions
How often do promoted teams stay up in the Premier League? Just over half the time: 49 of the 92 clubs promoted since 1995-96 survived their first season, 53 percent. The other 43 went straight back down.
How many times have all three promoted teams been relegated? Three times: in 1997-98, 2023-24 and 2024-25. All three have stayed up four times, most recently in 2022-23.
What is the best finish by a promoted team in the Premier League? Third, by Newcastle United in 1993-94 and Nottingham Forest in 1994-95, in 42-game seasons. Since the league went to 20 clubs, the best is fifth, by Ipswich Town in 2000-01 with 66 points.
Do play-off winners stay up less often? Yes: 45 percent of play-off winners have survived their first season, against 53 percent of runners-up and 61 percent of champions.
Do promoted teams survive their second season? Usually. Of the 47 clubs that stayed up and have played a second season, 36 survived it, 77 percent.
How this was built: final tables for every Premier League season from 1995-96 to 2025-26, rebuilt from the results of all 11,780 games published by football-data.co.uk and ranked on points, goal difference and goals scored, the league's own order. Point deductions count as in the official tables: Middlesbrough's three in 1996-97, Portsmouth's nine in 2009-10, and in 2023-24 Everton's eight (ten, cut to six, then two more) and Nottingham Forest's four. Every table matches ESPN's final standings from 2002-03 on and the season tables on Wikipedia for all 31 seasons, place by place. A promoted club is one in the Premier League that played in the second tier (First Division until 2003-04, Championship since) the season before; its route comes from that second-tier table, also rebuilt from football-data.co.uk results with each season's deductions and tie-breakers, and checked place by place against the final tables on Wikipedia. A club stays up by finishing 17th or higher. The three 22-club seasons, 1992-93 to 1994-95, are left out of every count. Points from the first five games count each club's first five league games. The 2026-27 table covers the 50 games played through 20 September 2026 and matches Sky Sports' table of 30 September; the relegation odds are those of our 20,000 simulations published on 28 September, after the same five matchdays.