What it takes depends on the runner-up as much as on the champion: a title is won by finishing ahead of second place, however many points that is. We rebuilt the final table of every season since 1995-96, when the league went to 20 clubs and 38 games, from the match results published by football-data.co.uk. The first three seasons, from 1992-93, had 22 clubs and 42 games each and are left out.
How many points to win the Premier League: the history
Champions have averaged 87.5 points and runners-up 80.5, so the typical title has been won by about seven points. The median champion had 87. Eleven champions reached 90 or more, 35 percent of them, and six won with 81 or fewer, the last of them Leicester City in 2015-16.
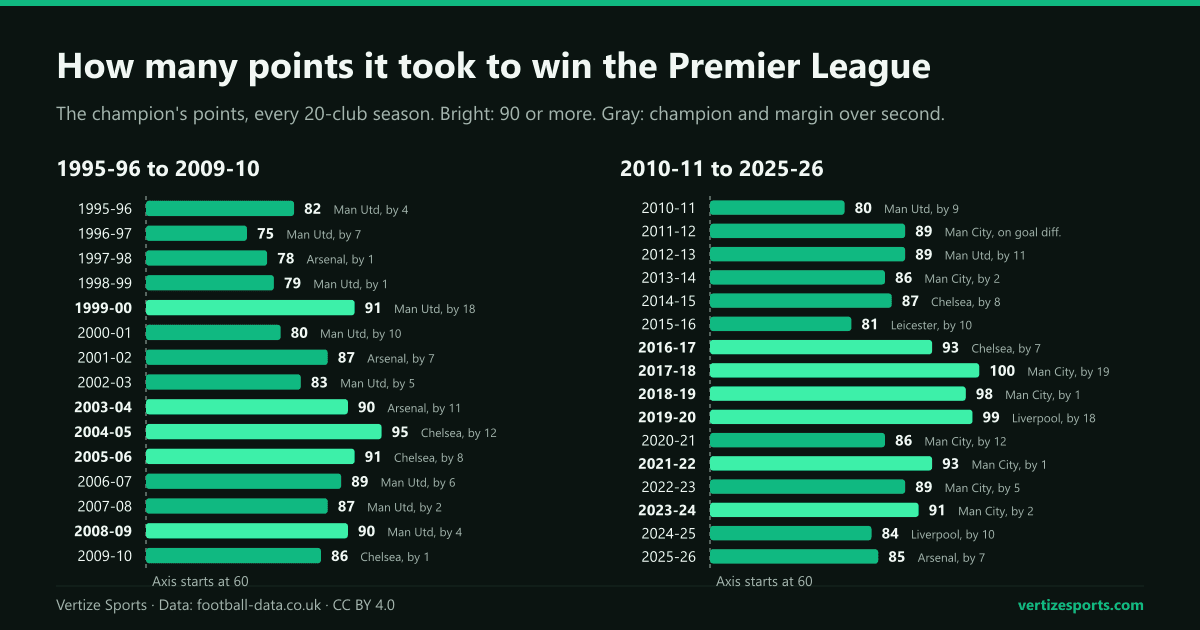
The winning total has climbed over time. Champions averaged 84.0 points in the first ten seasons of the 20-club league, 87.4 in the next ten and 90.8 in the last eleven. Over the same spans the relegation line fell from 36.5 points to 32.6, as our analysis of the points it takes to stay up found, so the league has stretched at both ends.
The last two titles went against the trend. Liverpool won with 84 points in 2024-25 and Arsenal with 85 last season, the two lowest winning totals since 2015-16.
Points needed to win the Premier League: how often 90 was enough
The total that wins a title outright is one more than the runner-up's. Here is how often each total would have been enough, counting only the seasons in which it beats second place on points. A team level with the runner-up can still win on goal difference, so these shares are the safe side of the answer.
| Points | Enough to win the title | Share of seasons |
|---|---|---|
| 80 | 15 of 31 | 48% |
| 82 | 18 of 31 | 58% |
| 84 | 21 of 31 | 68% |
| 86 | 25 of 31 | 81% |
| 87 | 27 of 31 | 87% |
| 90 | 29 of 31 | 94% |
| 93 | 30 of 31 | 97% |
| 98 | 31 of 31 | 100% |
Ninety points would have won the title in 29 of the 31 seasons. Both exceptions belong to Liverpool, who finished second with 97 points in 2018-19 and with 92 in 2021-22, one point behind Manchester City each time. Only 98 has been enough every time.
Lowest points to win the Premier League
The lowest winning total is 75, by Manchester United in 1996-97, seven points clear of Newcastle United, Arsenal and Liverpool, who all finished on 68. The next two lowest followed straight after: Arsenal won with 78 in 1997-98 and United with 79 in 1998-99, each by a single point.
No champion since has finished below 80. United won with exactly 80 in 2000-01 and 2010-11, and Leicester City with 81 in 2015-16, ten points clear of Arsenal.
Most points in a Premier League season
Manchester City's 100 points in 2017-18 is the record, the only time a team has reached three figures. Liverpool's 99 in 2019-20 and City's 98 in 2018-19 are next.
The 2018-19 season also produced the highest total for a team that did not win the league: Liverpool finished second with 97 points, a total that would have won the title in 28 of the other 30 seasons. Four times, all since 2011-12, the champion needed 90 or more to finish clear on points: 90 in 2011-12, when City won on goal difference with 89, and again in 2023-24; 93 in 2021-22; and 98 in 2018-19.
The tightest and widest Premier League title races
Nine of the 31 titles were decided by two points or fewer, and Manchester City won five of them. The closest was 2011-12, when City and Manchester United both finished with 89 points and City won on goal difference, +64 to United's +56.
- Level on points: 2011-12 Manchester City (89) over Manchester United, on goal difference.
- One point: 1997-98 Arsenal (78) over Manchester United, 1998-99 Manchester United (79) over Arsenal, 2009-10 Chelsea (86) over Manchester United, 2018-19 Manchester City (98) over Liverpool, 2021-22 Manchester City (93) over Liverpool.
- Two points: 2007-08 Manchester United (87) over Chelsea, 2013-14 Manchester City (86) over Liverpool, 2023-24 Manchester City (91) over Arsenal.
At the other end, three titles were won by 18 points or more: City by 19 over United in 2017-18, United by 18 over Arsenal in 1999-2000 and Liverpool by 18 over City in 2019-20. The median margin is seven points, exactly Arsenal's margin over City last season.
Premier League champions' points by season
Every season of the 20-club league, most recent first. Manchester United won 11 of the 31 titles, Manchester City eight, Chelsea five, Arsenal four, Liverpool two and Leicester City one.
| Season | Champion | Points | Runner-up | Points | 4th | 5th |
|---|---|---|---|---|---|---|
| 2025-26 | Arsenal | 85 | Manchester City | 78 | 65 | 60 |
| 2024-25 | Liverpool | 84 | Arsenal | 74 | 69 | 66 |
| 2023-24 | Manchester City | 91 | Arsenal | 89 | 68 | 66 |
| 2022-23 | Manchester City | 89 | Arsenal | 84 | 71 | 67 |
| 2021-22 | Manchester City | 93 | Liverpool | 92 | 71 | 69 |
| 2020-21 | Manchester City | 86 | Manchester United | 74 | 67 | 66 |
| 2019-20 | Liverpool | 99 | Manchester City | 81 | 66 | 62 |
| 2018-19 | Manchester City | 98 | Liverpool | 97 | 71 | 70 |
| 2017-18 | Manchester City | 100 | Manchester United | 81 | 75 | 70 |
| 2016-17 | Chelsea | 93 | Tottenham Hotspur | 86 | 76 | 75 |
| 2015-16 | Leicester City | 81 | Arsenal | 71 | 66 | 66 |
| 2014-15 | Chelsea | 87 | Manchester City | 79 | 70 | 64 |
| 2013-14 | Manchester City | 86 | Liverpool | 84 | 79 | 72 |
| 2012-13 | Manchester United | 89 | Manchester City | 78 | 73 | 72 |
| 2011-12 | Manchester City | 89 | Manchester United | 89 | 69 | 65 |
| 2010-11 | Manchester United | 80 | Chelsea | 71 | 68 | 62 |
| 2009-10 | Chelsea | 86 | Manchester United | 85 | 70 | 67 |
| 2008-09 | Manchester United | 90 | Liverpool | 86 | 72 | 63 |
| 2007-08 | Manchester United | 87 | Chelsea | 85 | 76 | 65 |
| 2006-07 | Manchester United | 89 | Chelsea | 83 | 68 | 60 |
| 2005-06 | Chelsea | 91 | Manchester United | 83 | 67 | 65 |
| 2004-05 | Chelsea | 95 | Arsenal | 83 | 61 | 58 |
| 2003-04 | Arsenal | 90 | Chelsea | 79 | 60 | 56 |
| 2002-03 | Manchester United | 83 | Arsenal | 78 | 67 | 64 |
| 2001-02 | Arsenal | 87 | Liverpool | 80 | 71 | 66 |
| 2000-01 | Manchester United | 80 | Arsenal | 70 | 68 | 66 |
| 1999-00 | Manchester United | 91 | Arsenal | 73 | 67 | 65 |
| 1998-99 | Manchester United | 79 | Arsenal | 78 | 67 | 57 |
| 1997-98 | Arsenal | 78 | Manchester United | 77 | 63 | 59 |
| 1996-97 | Manchester United | 75 | Newcastle United | 68 | 68 | 61 |
| 1995-96 | Manchester United | 82 | Newcastle United | 78 | 63 | 63 |
Points needed for top four and the Champions League places
Four Champions League qualification places were available to English clubs for the first time in 2001-02. Since then the team in fourth has averaged 69.4 points, from 60 by Liverpool in 2003-04 to 79 by Arsenal in 2013-14. Last season Aston Villa were fourth with 65, the fewest for a fourth-placed team since Everton's 61 in 2004-05.
Seventy points would have guaranteed a top-four finish in 20 of those 25 seasons and 73 in 24 of them. Only 76 was always enough, because Arsenal finished fifth with 75 points in 2016-17.
Fourth place has not always been enough, and lately fifth has been. In 2011-12 Tottenham Hotspur finished fourth with 69 points and still missed out, because Chelsea, sixth in the league, won the Champions League. Since the competition moved to a 36-team league phase in 2024-25, UEFA has also handed out European Performance Spots: an extra place each for the two countries whose clubs did best in Europe in the season just finished.
The first two went to Italy and Germany after 2023-24, so Tottenham, fifth that season with 66 points, missed out. England earned one after 2024-25 and again after 2025-26, and fifth place qualified: Newcastle United with 66 points and Liverpool with 60, level with Liverpool's 60 in 2003-04 as the fewest to reach the Champions League through the league since fourth place first counted.
The 2026-27 title race so far
Five matchdays into 2026-27, the Premier League table has Manchester City top with five wins from five, 15 points, three ahead of Arsenal and five ahead of Brighton & Hove Albion. Liverpool are one of four teams on nine points.
We played the remaining 330 games 20,000 times with the model behind the Vertize Premier League simulator. City win the title in 57 percent of simulated seasons and Arsenal in 38 percent; Liverpool, at 2.5 percent, are the only other club above 1 percent. The model rates City and Arsenal almost exactly level on last season's finish and the market value of their squads, so City's edge is the three points they already have: start the two level on 12 points and Arsenal come out slightly ahead, 48 percent to 45 percent.
| Club | Points now | Title | Top four | Top five |
|---|---|---|---|---|
| Manchester City | 15 | 57.2% | 99.1% | 99.6% |
| Arsenal | 12 | 38.0% | 97.9% | 99.3% |
| Liverpool | 9 | 2.5% | 61.0% | 75.8% |
| Manchester United | 5 | 0.9% | 44.1% | 61.4% |
| Chelsea | 7 | 1.0% | 41.4% | 58.7% |
| Brighton & Hove Albion | 10 | 0.4% | 25.2% | 40.5% |
| Aston Villa | 4 | 0.1% | 10.2% | 18.9% |
| Brentford | 9 | under 0.1% | 8.1% | 16.3% |
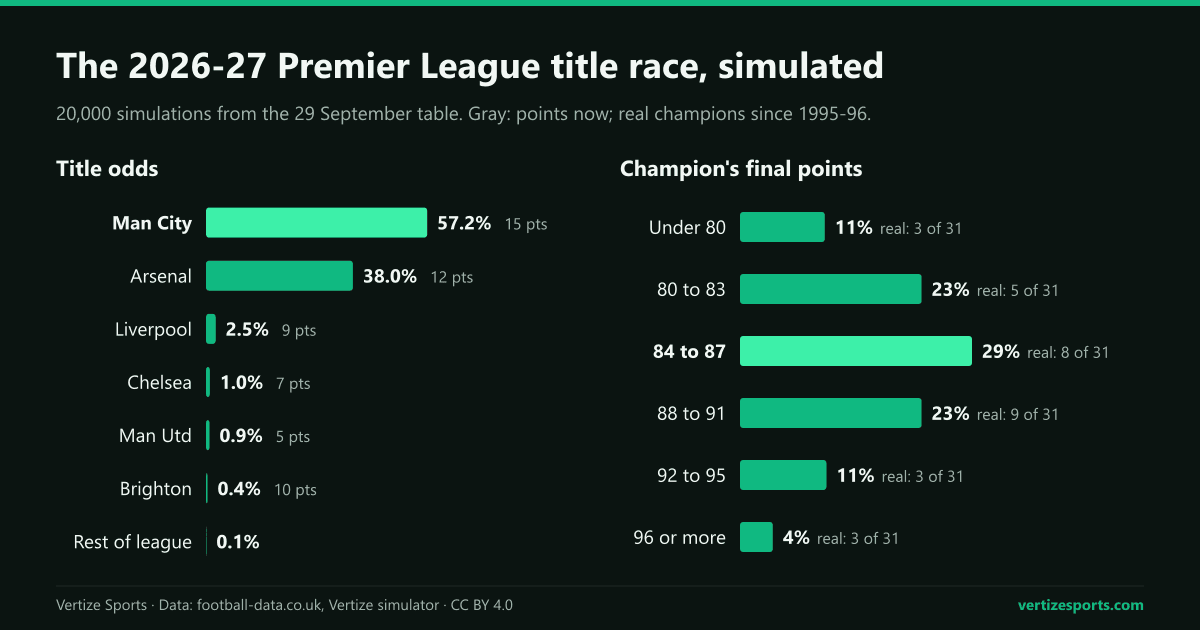
The simulated champion finishes with a median of 86 points, a little below the long-run average of 87.5, and with between 79 and 93 in 85 percent of seasons. It reaches 90 in 25 percent of simulations, against 35 percent of real seasons since 1995-96. Liverpool finish in the top four in 61 percent of simulations, Manchester United in 44 percent and Chelsea in 41 percent.
Fourth place ends with a median of 68 points and fifth with 65. Whether fifth counts again depends on how English clubs do in Europe this season, since UEFA hands out the extra places on each season's results. To play the season out yourself, put a score on any game still to come in the simulator or let the model fill in the rest. How much a lead at Christmas has been worth in May is in our look at the teams top of the table at Christmas.
Winning the Premier League: frequently asked questions
How many points do you need to win the Premier League? About 87 or 88: champions have averaged 87.5 points since 1995-96. Ninety points would have been enough in 29 of 31 seasons, and 98 in all of them.
What is the lowest points total to win the Premier League? Seventy-five, by Manchester United in 1996-97. No champion since 1998-99 has finished with fewer than 80.
What is the most points in a Premier League season? One hundred, by Manchester City in 2017-18. The most for a team that did not win the title is 97, by Liverpool in 2018-19.
How many points do you need for the top four? About 70. Fourth place has averaged 69.4 points since 2001-02, and 70 was enough for a top-four finish in 20 of those 25 seasons.
Has the Premier League title been decided on goal difference? Once, in 2011-12, when Manchester City and Manchester United both finished with 89 points and City won on goal difference.
How this was built: final tables for every Premier League season from 1995-96 to 2025-26, rebuilt from the results of all 11,780 games published by football-data.co.uk and ranked on points, goal difference and goals scored, the league's own order. Point deductions count as in the official tables: Middlesbrough's three in 1996-97, Portsmouth's nine in 2009-10, and in 2023-24 Everton's eight (ten, cut to six, then two more) and Nottingham Forest's four; none of those clubs finished in the top six. Every table matches ESPN's final standings from 2002-03 on and the season tables on Wikipedia for all 31 seasons, place by place. A total counts as enough to win the title when it beats the runner-up on points. The three 22-club seasons, 1992-93 to 1994-95, are left out. The 2026-27 table covers the 50 games played through 20 September 2026 and matches Sky Sports' table of 29 September. The simulation plays the 330 remaining games 20,000 times with the model of the Vertize simulator: goals drawn from a Poisson distribution, 1.50 at home and 1.25 away between equal sides, with each team rated on last season's finish and its squad's market value and promoted clubs starting as the second-weakest side. It is the same run, with the same random draws, as our relegation odds.