We took the final table and every finals result of the 29 Super Rugby seasons that crowned a champion, 1996 to 2019 and 2022 to 2026, and counted how far each table position went.
How often the top of the Super Rugby table wins the title
The table-toppers reached the final 25 times in 29 seasons, 86 percent, and won 17 of those 25 finals. That is a far better record than in the NRL or the AFL: the NRL minor premiers have won 10 of 29 grand finals since 1998, and the AFL minor premier 11 of 33 flags since 1994.
Only four table-toppers missed the final, all beaten in a semifinal: the Queensland Reds in 1996 and 1999, the Stormers in 2012 and the Hurricanes in 2024. The other eight lost the final itself, and six of those eight were beaten by the Crusaders:
- 1998 Blues: lost 13-20 to the Crusaders.
- 2000 Brumbies: lost 19-20 to the Crusaders.
- 2007 Sharks: lost 19-20 to the Bulls.
- 2015 Hurricanes: lost 14-21 to the Highlanders.
- 2017 Lions: lost 17-25 to the Crusaders.
- 2022 Blues: lost 7-21 to the Crusaders.
- 2023 Chiefs: lost 20-25 to the Crusaders.
- 2025 Chiefs: lost 12-16 to the Crusaders.
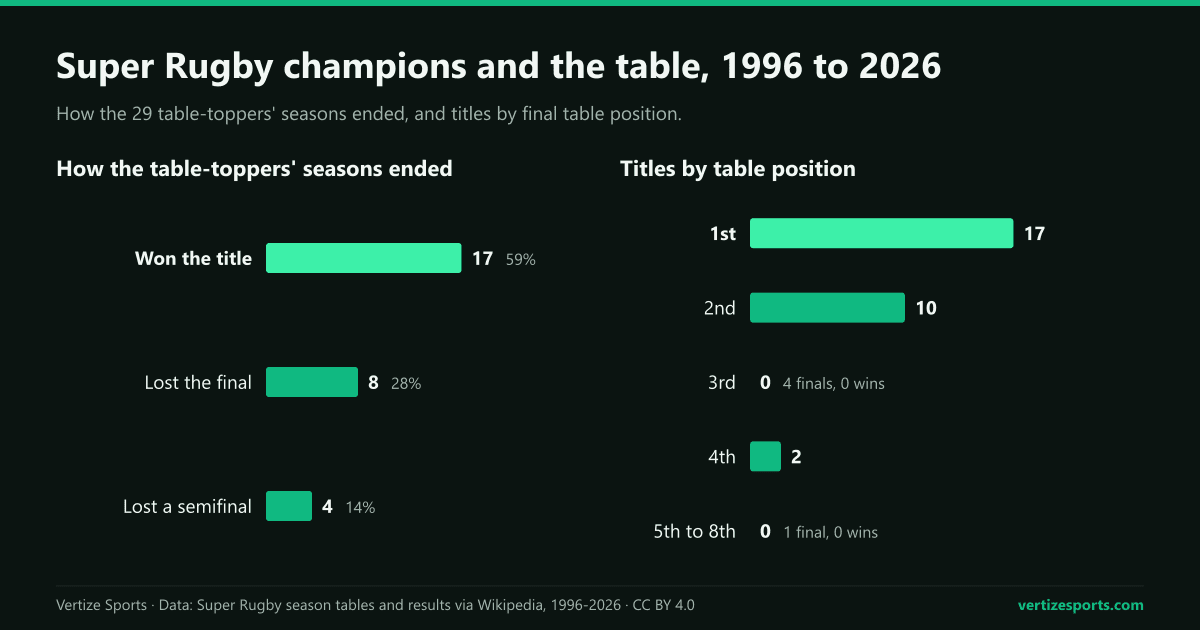
The edge has narrowed as the finals grew. In the top-four era, 1996 to 2010, the table-toppers won 10 of 15 titles, 67 percent. Since the six- and eight-team finals began in 2011 they have won 7 of 14, 50 percent, and in the Super Rugby Pacific era only the 2026 Hurricanes have finished first and lifted the trophy.
Super Rugby champions by table position
Every champion has finished in the top four, and 27 of the 29 in the top two, 93 percent. The third-placed team has reached four finals and lost all four. The only champions from fourth were the Crusaders in 1999, who won their semifinal against the Reds in Brisbane and the final against the Highlanders in Dunedin, and the Highlanders in 2015, who beat the Hurricanes in Wellington.
| Table position | Seasons in the finals | Finals record | Finals reached | Titles |
|---|---|---|---|---|
| 1st | 29 | 50-13 | 25 | 17 |
| 2nd | 29 | 43-19 | 24 | 10 |
| 3rd | 29 | 14-29 | 4 | 0 |
| 4th | 29 | 16-28 | 4 | 2 |
| 5th | 14 | 2-14 | 0 | 0 |
| 6th | 14 | 6-14 | 1 | 0 |
| 7th | 7 | 0-7 | 0 | 0 |
| 8th | 7 | 0-7 | 0 | 0 |
Teams from fifth to eighth have won 8 of their 50 finals games, and the only one to reach a final was the sixth-placed Sharks in 2012, who won in Brisbane and Cape Town before losing 37-6 to the Chiefs in Hamilton.
Home advantage is a large part of the pattern, because the higher-placed team hosts. Home teams won 107 of the 131 finals games, 82 percent, and the champion was at home in 21 of the 29 finals, 72 percent.
Super Rugby titles by club: the Crusaders' 13
The Crusaders have won 13 of the 29 titles, 45 percent, and played in 17 finals. They won three in a row twice, from 1998 to 2000 and from 2017 to 2019. They topped the table six times and won the title all six times, and seven of their titles came from second or fourth.
The Blues have four titles, the Bulls three, and the Brumbies, Chiefs and Hurricanes two each. The Queensland Reds, NSW Waratahs and Highlanders have one each, and no South African side other than the Bulls has won it.
| Season | Top of the table (pts) | How it ended | Champion (position) | Final |
|---|---|---|---|---|
| 1996 | Queensland Reds (41) | Lost a semifinal | Blues (2nd) | Blues 45-21 Sharks |
| 1997 | Blues (50) | Won the title | Blues (1st) | Blues 23-7 Brumbies |
| 1998 | Blues (43) | Lost the final | Crusaders (2nd) | Crusaders 20-13 Blues |
| 1999 | Queensland Reds (36) | Lost a semifinal | Crusaders (4th) | Crusaders 24-19 Highlanders |
| 2000 | Brumbies (45) | Lost the final | Crusaders (2nd) | Crusaders 20-19 Brumbies |
| 2001 | Brumbies (40) | Won the title | Brumbies (1st) | Brumbies 36-6 Sharks |
| 2002 | Crusaders (51) | Won the title | Crusaders (1st) | Crusaders 31-13 Brumbies |
| 2003 | Blues (49) | Won the title | Blues (1st) | Blues 21-17 Crusaders |
| 2004 | Brumbies (40) | Won the title | Brumbies (1st) | Brumbies 47-38 Crusaders |
| 2005 | Crusaders (45) | Won the title | Crusaders (1st) | Crusaders 35-25 NSW Waratahs |
| 2006 | Crusaders (51) | Won the title | Crusaders (1st) | Crusaders 19-12 Hurricanes |
| 2007 | Sharks (45) | Lost the final | Bulls (2nd) | Bulls 20-19 Sharks |
| 2008 | Crusaders (52) | Won the title | Crusaders (1st) | Crusaders 20-12 NSW Waratahs |
| 2009 | Bulls (46) | Won the title | Bulls (1st) | Bulls 61-17 Chiefs |
| 2010 | Bulls (47) | Won the title | Bulls (1st) | Bulls 25-17 Stormers |
| 2011 | Queensland Reds (66) | Won the title | Queensland Reds (1st) | Queensland Reds 18-13 Crusaders |
| 2012 | Stormers (66) | Lost a semifinal | Chiefs (2nd) | Chiefs 37-6 Sharks |
| 2013 | Chiefs (66) | Won the title | Chiefs (1st) | Chiefs 27-22 Brumbies |
| 2014 | NSW Waratahs (58) | Won the title | NSW Waratahs (1st) | NSW Waratahs 33-32 Crusaders |
| 2015 | Hurricanes (66) | Lost the final | Highlanders (4th) | Highlanders 21-14 Hurricanes |
| 2016 | Hurricanes (53) | Won the title | Hurricanes (1st) | Hurricanes 20-3 Lions |
| 2017 | Lions (65) | Lost the final | Crusaders (2nd) | Crusaders 25-17 Lions |
| 2018 | Crusaders (63) | Won the title | Crusaders (1st) | Crusaders 37-18 Lions |
| 2019 | Crusaders (58) | Won the title | Crusaders (1st) | Crusaders 19-3 Jaguares |
| 2022 | Blues (58) | Lost the final | Crusaders (2nd) | Crusaders 21-7 Blues |
| 2023 | Chiefs (59) | Lost the final | Crusaders (2nd) | Crusaders 25-20 Chiefs |
| 2024 | Hurricanes (56) | Lost a semifinal | Blues (2nd) | Blues 41-10 Chiefs |
| 2025 | Chiefs (51) | Lost the final | Crusaders (2nd) | Crusaders 16-12 Chiefs |
| 2026 | Hurricanes (55) | Won the title | Hurricanes (1st) | Hurricanes 60-5 Chiefs |
New Zealand vs Australia vs South Africa: titles by country
New Zealand teams have won 22 of the 29 titles, 76 percent, Australian teams four (the Brumbies in 2001 and 2004, the Reds in 2011 and the Waratahs in 2014) and South African teams three, all by the Bulls, in 2007, 2009 and 2010.
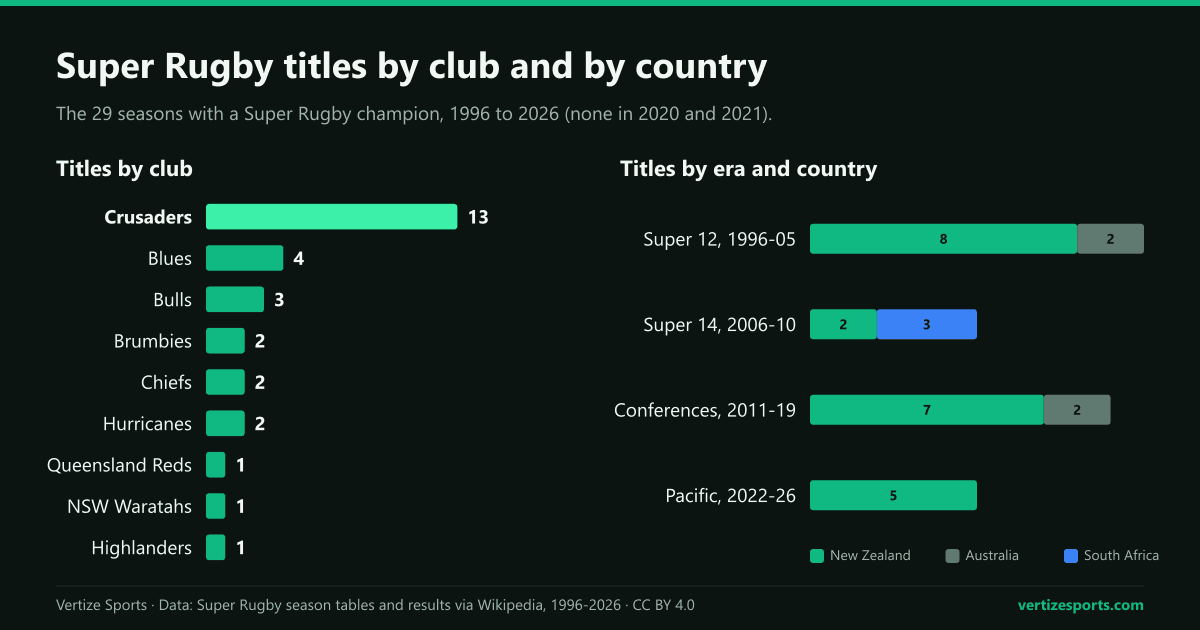
A New Zealand team has won every title since 2015, 10 in a row. No Australian side has reached a final since the Waratahs won in 2014; the Lions lost three straight finals from 2016 to 2018 and the Jaguares lost in Christchurch in 2019. All five Super Rugby Pacific finals have been between New Zealand teams.
How the Super Rugby format changed, from Super 12 to Super Rugby Pacific
The competition has changed shape several times. Teams, regular-season games per team and finals places:
- Super 12, 1996-2005: 12 teams from New Zealand, Australia and South Africa, 11 games each, top four to the semifinals.
- Super 14, 2006-2010: 14 teams, 13 games each, top four.
- Super Rugby with conferences, 2011-2015: 15 teams in three national conferences, 16 games each, six-team finals with byes for the top two.
- 18 teams, 2016-2017: the Jaguares from Argentina and the Sunwolves from Japan joined and the Southern Kings returned, 15 games, eight-team quarterfinals.
- 15 teams, 2018-2019: three conferences again, 16 games, eight-team quarterfinals.
- Super Rugby Pacific, 2022-2024: 12 teams from New Zealand, Australia and the Pacific, one table, 14 games, top eight.
- 2025-2026: 11 teams, 14 games, top six.
In 2020 COVID-19 stopped the season and national competitions took over: the Crusaders topped Super Rugby Aotearoa, which had no final, and the Brumbies beat the Reds 28-23 in the Super Rugby AU final. In 2021 the Crusaders beat the Chiefs 24-13 in the Aotearoa final, the Reds beat the Brumbies 19-16 in the AU final, and the Blues beat the Highlanders 23-15 in the Super Rugby Trans-Tasman final. In September 2020 South Africa's unions voted to seek a move north for their four teams, and the competition returned in 2022 as Super Rugby Pacific without them.
In 2025 the top-placed Chiefs lost their qualifying final 20-19 to the Blues and still went through as the best-ranked loser, dropping one place, then lost the final 16-12 to the Crusaders in Christchurch. For 2026 the rule was tightened: the best-ranked loser now goes through as the fourth seed and plays away.
The 2026 Super Rugby Pacific champions: the Hurricanes
The Hurricanes finished the 2026 regular season 11-3 with 55 points and a points difference of +264, the best in the competition, four points clear of the Chiefs, who were also 11-3 but had four fewer bonus points (final table). The Crusaders, Blues, Queensland Reds and Brumbies completed the top six.
The Hurricanes then beat the Brumbies 66-12, the Blues 57-21 and the Chiefs 60-5, 183 points to 38 over three home finals in Wellington. The Blues went through as the best-ranked loser after losing 52-31 to the Crusaders. The Chiefs beat the Reds 46-24 and the Crusaders 49-12 in Hamilton.
The final at Hnry Stadium, which kicked off at 7:05 pm NZST on 20 June, was the biggest winning margin in a Super Rugby final, 55 points, beating the Bulls' 61-17 win over the Chiefs in 2009. It was the Hurricanes' second title after 2016 and the fourth straight final the Chiefs have lost, after 2023, 2024 and 2025 (match report).
On Vertize you can follow the Super Rugby Pacific table, the 2027 draw and a table predictor that applies the bonus-point rules. The same question elsewhere: how often the A-League premiers win the Grand Final and the NBL minor premiers win the championship.
Super Rugby champions: frequently asked questions
How often does the team top of the Super Rugby table win the title? 17 times in the 29 seasons with a champion from 1996 to 2026, 59 percent. Table-toppers reached the final 25 times.
Which team has won the most Super Rugby titles? The Crusaders, with 13: 1998, 1999, 2000, 2002, 2005, 2006, 2008, 2017, 2018, 2019, 2022, 2023 and 2025.
Who won Super Rugby in 2026? The Hurricanes, who beat the Chiefs 60-5 in the final in Wellington on 20 June 2026 after finishing top of the table.
Has a team from outside the top two won Super Rugby? Twice, both from fourth: the Crusaders in 1999 and the Highlanders in 2015. No team from third or lower than fourth has won the title.
How this was built: the final regular-season table and every finals game of the 29 Super Rugby seasons that crowned a champion, 1996 to 2019 and 2022 to 2026, 131 finals games in all, taken from the tables and match records on Wikipedia's season pages, read on 5 October 2026, and checked against the official match reports for 2026. Positions are the official ones (conference winners first in 2011-2019); every table-topper also had the most competition points. The 2020 and 2021 national competitions are not counted.