We took the final regular-season table and the play-off results of every English top-flight season from 1987-88 to 2025-26 from Wikipedia's season pages, checked the 2025-26 table against TNT Sports, and counted where the line fell between fourth and fifth. The league is now branded PREM Rugby; most fans still call it the Premiership.
How many points it takes to make the Premiership top four
A team gets four points for a win and two for a draw, plus a bonus point for scoring four or more tries and another for losing by seven points or fewer. With 10 clubs since 2023-24, each plays 18 games, and the top four go into home semi-finals: first plays fourth and second plays third.
- 2023-24: Saracens were fourth on 56 points; the Bristol Bears missed on 54.
- 2024-25: Bristol were fourth on 58 and Gloucester Rugby fifth on 56, both with 10 wins.
- 2025-26: the Leicester Tigers were fourth on 63 with a 12-0-6 record; Saracens missed on 57 at 10-0-8.
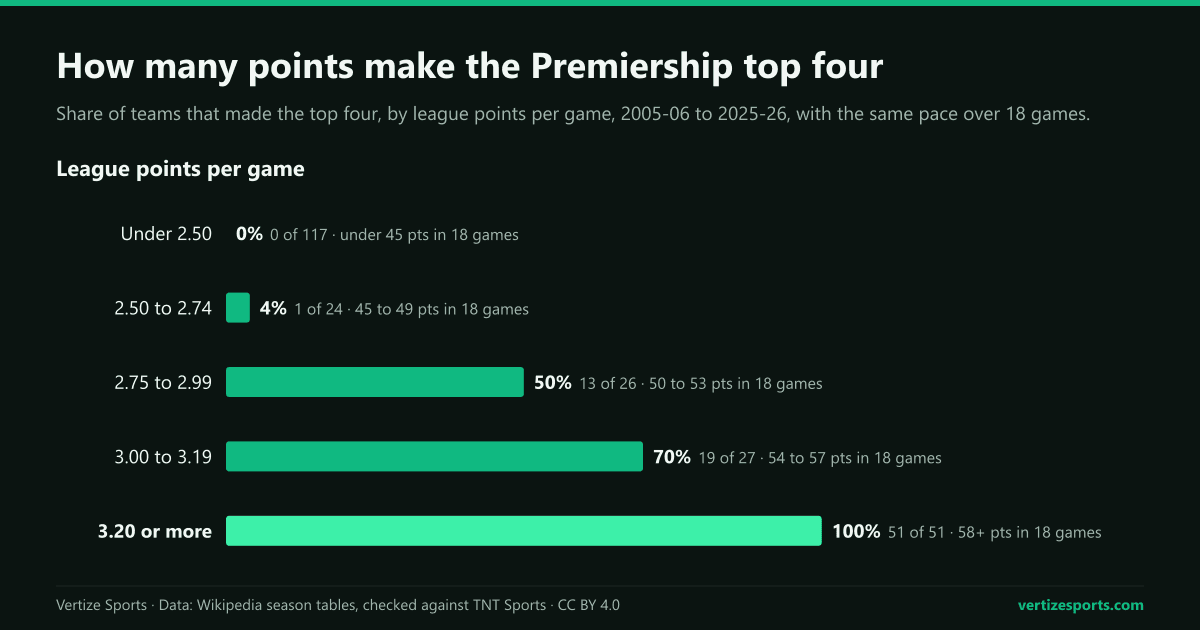
Three seasons is a small sample, so we also put every team since 2005-06, when the play-offs grew to four, on a per-game basis. No team averaging 3.20 points a game or more has missed the top four, which is 58 points over 18 games. Between 2.75 and 2.99 a game, 50 to 53 points in today's format, it was a coin flip: 13 of 26 teams got in.
The highest points total to miss the play-offs, and the lowest to make it
In the 16 seasons of 22 games from 2005-06 to 2020-21, fourth place had a median of 65 points, from 56 to 71. The extremes:
- Most to miss: the Exeter Chiefs had 68 points in 2014-15 and finished fifth, level with Saracens and the Leicester Tigers. Leicester went third on wins, and Saracens edged Exeter on points difference, +246 to +226, then won the title from fourth.
- Highest rate to miss: Saracens' 57 points in 18 games in 2025-26 is 3.17 a game, the best of any fifth-placed team since 2005-06.
- Fewest to make it: the Northampton Saints got in with 56 points and an 11-0-11 record in 2018-19, ahead of Harlequins and Bath Rugby on the same total because they had won one more game.
- Biggest gap: Harlequins were fourth on 71 points in 2020-21, 14 ahead of Northampton, and won the final.
Fourth and fifth have finished level on points four times since 2005-06: in 2013-14, 2014-15, 2017-18 and 2018-19. The tiebreaker is the number of wins first and points difference second, so a win is worth more than its four points in a close race.
| Season | Games | 4th (last in) | Points | 5th (first out) | Points |
|---|---|---|---|---|---|
| 2025-26 | 18 | Leicester | 63 | Saracens | 57 |
| 2024-25 | 18 | Bristol | 58 | Gloucester | 56 |
| 2023-24 | 18 | Saracens | 56 | Bristol | 54 |
| 2022-23 | 20 | Northampton | 58 | London Irish | 55 |
| 2021-22 | 24 | Northampton | 75 | Gloucester | 73 |
| 2020-21 | 22 | Harlequins | 71 | Northampton | 57 |
| 2019-20 | 22 | Bath | 67 | Sale | 64 |
| 2018-19 | 22 | Northampton | 56 | Harlequins | 56 |
| 2017-18 | 22 | Newcastle | 63 | Leicester | 63 |
| 2016-17 | 22 | Leicester | 66 | Bath | 59 |
| 2015-16 | 22 | Leicester | 65 | Northampton | 60 |
| 2014-15 | 22 | Saracens | 68 | Exeter | 68 |
| 2013-14 | 22 | Harlequins | 67 | Bath | 67 |
| 2012-13 | 22 | Northampton | 65 | Gloucester | 60 |
| 2011-12 | 22 | Northampton | 65 | Exeter | 59 |
| 2010-11 | 22 | Northampton | 65 | Bath | 62 |
| 2009-10 | 22 | Bath | 61 | Wasps | 57 |
| 2008-09 | 22 | Bath | 65 | Sale | 61 |
| 2007-08 | 22 | Leicester | 64 | Sale | 63 |
| 2006-07 | 22 | Saracens | 63 | Wasps | 61 |
| 2005-06 | 22 | Wasps | 64 | Gloucester | 59 |
How often the team top of the table wins the Premiership final
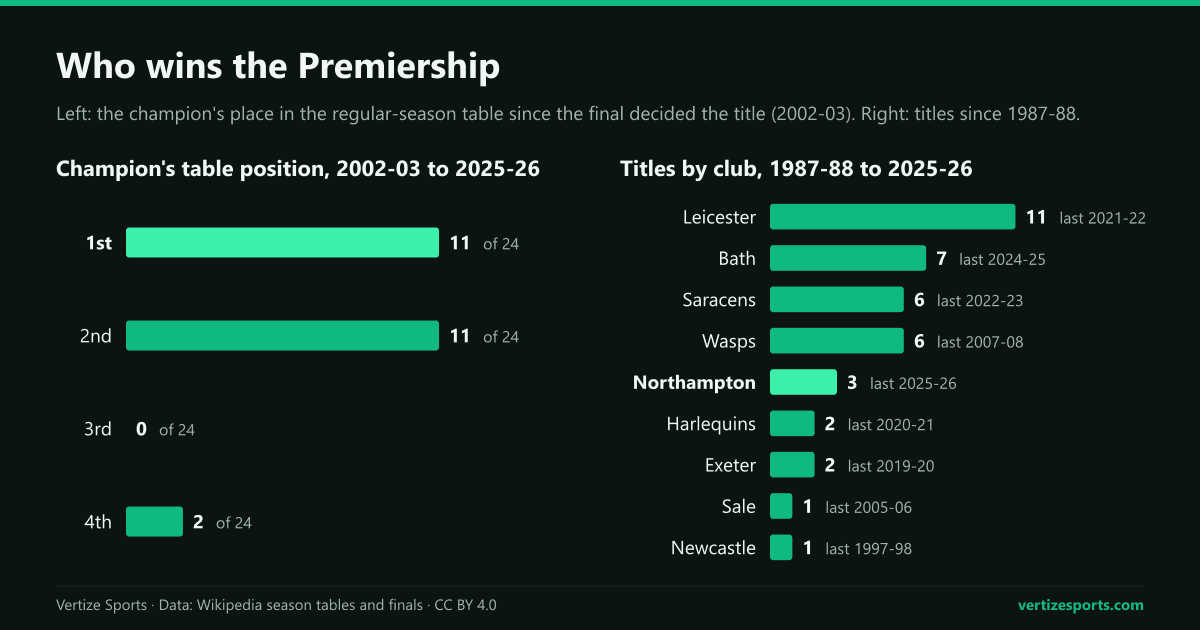
From 1987-88 to 2001-02 the team top of the league was champion. Since 2002-03 the title has gone to the winner of a final at Twickenham, and the league leader has won it 11 times in 24 seasons, 46 percent. That is a better rate than the minor premiers in Australia: 10 of 29 NRL grand finals and 11 of 33 AFL flags.
- Won the title: 11 times, including the last five, from Leicester in 2021-22 to Northampton in 2025-26. In the 19 seasons before that, the leader won six.
- Lost the final: nine times, including all three seasons from 2002-03 to 2004-05, when only the top three qualified and the leader went straight to the final.
- Lost at home in the semi-final: four times: Gloucester in 2007-08, Saracens in 2012-13, Northampton in 2014-15 and Bristol in 2020-21.
Every champion since 2002-03 has finished first, second or fourth in the table; none has come from third. The table-toppers and the runners-up have 11 titles each, and two have come from fourth: Saracens in 2014-15 and Harlequins in 2020-21. Home sides won 35 of the 42 semi-finals since 2005-06, 83 percent, and the league leaders won 17 of their 21.
Premiership champions by club: Leicester, Bath, Saracens and Wasps
Nine clubs have been English champions in 39 seasons. Leicester have the most titles, 11, including four in a row from 1998-99 to 2001-02, and have played in 11 of the 24 finals. Bath won six of the first nine titles and their seventh in 2024-25. Wasps won six, the last in 2007-08, and left the league when they went into administration in October 2022.
Northampton beat Exeter 26-17 in the 2025-26 final at Allianz Stadium, Twickenham, on 20 June 2026, after topping the table on 74 points. It was their third title and their second in three seasons, and it broke a run of six different champions from 2019-20 to 2024-25.
| Club | Titles | Seasons |
|---|---|---|
| Leicester | 11 | 1987-88, 1994-95, 1998-99, 1999-00, 2000-01, 2001-02, 2006-07, 2008-09, 2009-10, 2012-13, 2021-22 |
| Bath | 7 | 1988-89, 1990-91, 1991-92, 1992-93, 1993-94, 1995-96, 2024-25 |
| Saracens | 6 | 2010-11, 2014-15, 2015-16, 2017-18, 2018-19, 2022-23 |
| Wasps | 6 | 1989-90, 1996-97, 2002-03, 2003-04, 2004-05, 2007-08 |
| Northampton | 3 | 2013-14, 2023-24, 2025-26 |
| Harlequins | 2 | 2011-12, 2020-21 |
| Exeter | 2 | 2016-17, 2019-20 |
| Sale | 1 | 2005-06 |
| Newcastle | 1 | 1997-98 |
Saracens' relegation in 2019-20 for salary cap breaches
Saracens won five titles between 2010-11 and 2018-19, and were then punished for breaking the salary cap in earlier seasons. In November 2019 they were docked 35 points and fined £5.3 million; in January 2020 a further 70-point deduction confirmed their relegation at the end of the season.
On the field, Saracens went 13-1-8 with 13 bonus points in 2019-20. That is 67 points, the same as Bath, who held fourth place because they had 14 wins to Saracens' 13: even without the deduction, Saracens would have finished fifth and missed the play-offs. With minus 105 they ended on minus 38. They spent 2020-21 in the second tier, returned in 2021-22, lost the final to Leicester, and won the 2022-23 title after topping the table.
How bonus points change the Premiership table
Bonus points have become a much bigger part of the table. They made up 16 percent of all league points in 2000-01 and 17 percent in 2005-06, and 27 percent in each of the last two seasons, when teams averaged 0.74 bonus points a game, up from 0.42 in 2005-06.
Three times since 2005-06 a team made the top four with fewer points from wins and draws than a team it finished above, thanks to bonus points, and Sale Sharks were the team left out each time:
- 2007-08: Leicester, 13-0-9 with 12 bonus points, finished fourth on 64; Sale, 14-0-8 with 7, were fifth on 63.
- 2008-09: London Irish, 12-1-9 with 16 bonus points, were third and reached the final; Sale, 13-0-9, were fifth.
- 2018-19: Northampton, 11-0-11 with 12 bonus points, were fourth on 56; Sale, 11-2-9 with 7, were seventh on 55.
Bonus points have also decided first place twice, both times for Leicester. In 2009-10 they topped the table over Northampton, who had won one more game. In 2010-11 Saracens went 18-0-4 but took only 4 bonus points, and Leicester, at 16-1-5 with 12, finished two points ahead; Saracens beat them in the final.
PREM Rugby 2026-27: the table after two rounds
The 2026-27 season started on 25 September, and two of the 18 rounds have been played as of 5 October 2026. Gloucester, Bristol and Bath have won both their games with a try bonus each time and lead on 10 points; Gloucester's 48-0 win over Harlequins gives them the best points difference, +69. The champions, Northampton, are fourth on 6 points, level with Leicester and Saracens, after Sale beat Saracens 21-17 on Sunday.
Exeter have 3 bonus points from two defeats, the Newcastle Red Bulls 2 and Harlequins none. Round 3 is played from Friday 9 to Sunday 11 October, and the final is on Saturday 19 June 2027 at Allianz Stadium. RugbyPass carries the live table; on Vertize you can follow the Premiership table, the fixtures and a table predictor that applies the bonus-point rules. For the same question in American leagues, we counted the wins it takes to make the playoffs in the NFL, NBA, NHL and MLB, and for rugby league, the points needed for the NRL top eight.
Premiership Rugby play-offs: frequently asked questions
How many points do you need to make the Premiership top four? In the 18-game format, fourth place has needed 56, 58 and 63 points, and the best team to miss had 57. Since 2005-06 every team with 3.20 points a game or more, 58 over 18 games, has made it.
Does the team top of the table usually win the Premiership? Less than half the time: 11 of 24 since the final began deciding the title in 2002-03, although the leader has won the last five finals.
Who has won the most Premiership titles? Leicester, with 11, the last in 2021-22. Bath have 7, Saracens and Wasps 6 each, and Northampton 3.
Why were Saracens relegated in 2020? For breaching the salary cap. They were docked 35 points in November 2019 and another 70 in January 2020, and finished the 2019-20 season bottom on minus 38.
How this was built: the final regular-season table and every play-off result of the 39 completed English top-flight seasons, 1987-88 to 2025-26, from the tables and match records on Wikipedia's season pages, read through the MediaWiki API on 5 October 2026. We recalculated every team's points from wins, draws, bonus points and deductions, checked the champions and league leaders against Wikipedia's separate list on the PREM Rugby page and the 2025-26 table against TNT Sports. The 2026-27 table was rebuilt from the 10 results of the first two rounds, listed on the season page, and matched RugbyPass. Per-game rates cover the 21 seasons with a top four, 2005-06 to 2025-26, and leave out Saracens in 2019-20.