We read every second-tier play-off since the first, in May 1987, from the season pages on Wikipedia: each club's league place, both legs of all 80 semi-finals and every final. The second tier was the Second Division until 1992, the First Division until 2004 and the Championship since.
Championship play-off history: which league place wins promotion
The format took a few years to settle. In 1987 and 1988 three second-tier clubs played a First Division club trying to avoid relegation: Charlton Athletic won in 1987 and stayed up, and in 1988 Middlesbrough, third in the second tier, beat Chelsea. In 1991 the play-offs were fourth to seventh, and in 1995 second to fifth. Every other season since 1989 has used third to sixth, with third playing sixth and fourth playing fifth.
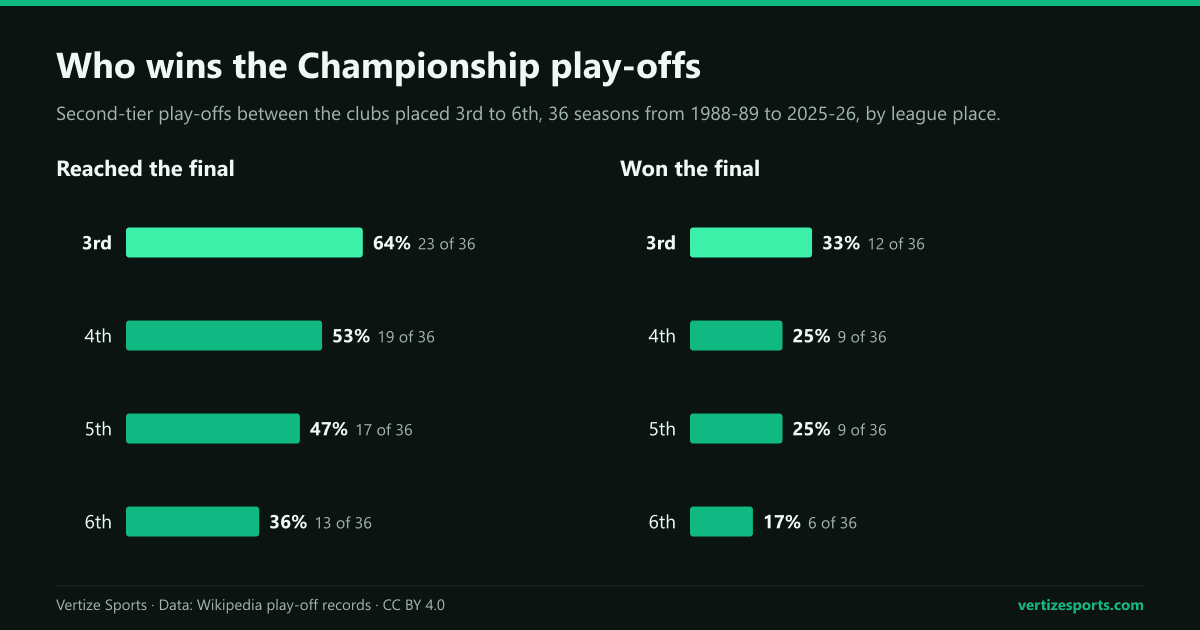
- 3rd: reached 23 of 36 finals and won 12, the last in 2023 with Luton Town.
- 4th: reached 19 finals and won 9, most recently with Sunderland in 2025.
- 5th: reached 17 finals and won 9, the same number as fourth.
- 6th: reached 13 finals and won 6, including Hull City in May 2026.
In those 36 seasons, winning the final and going up differ once. In 1990 Swindon Town, fourth, beat Sunderland at Wembley but were denied promotion after admitting financial irregularities, and Sunderland, sixth, went up instead. Counting promotions rather than final wins, fourth has gone up 8 times and sixth 7.
Championship play-off semi-finals: the second leg at home
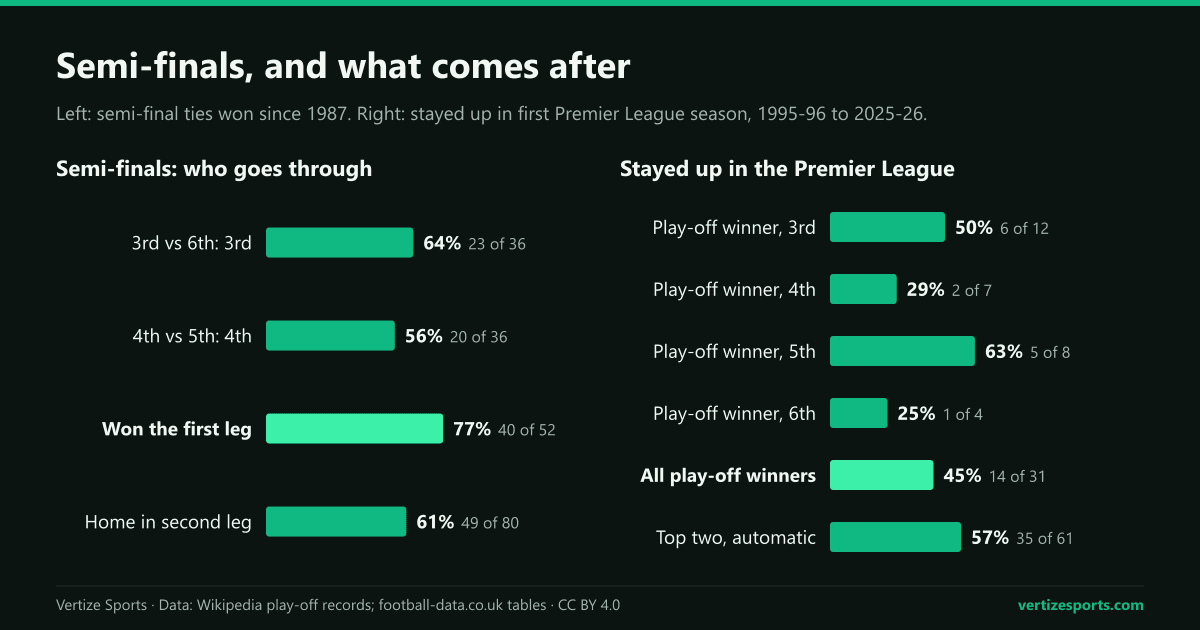
The higher-placed club plays the second leg at home, and that has been worth something but not much. Across all 80 semi-finals since 1987, the club at home in the second leg went through 49 times, 61 percent. Third beat sixth in 23 of 36 ties, 64 percent; fourth beat fifth in 20 of 36, 56 percent. These counts use results on the field, including Southampton's win over Middlesbrough in 2026.
The first leg matters more than the venue of the second. A club that won the first leg went through in 40 of 52 ties, 77 percent; 12 turned it round. When the first leg was drawn, which happened 28 times, the club at home in the second leg went through 16 times. Home sides won 36 percent of first legs and 59 percent of second legs.
- Penalties: 8 ties have gone to a shoot-out, the last in 2022, when Nottingham Forest beat Sheffield United.
- Away goals: 4 ties were settled that way, in 1987, 1989, 1997 and 1999.
- Extra time: 20 second legs needed it.
- Ipswich Town: lost 7 second-tier semi-finals from 1987 to 2015, the most of any club.
Championship play-off final results at Wembley
The first three finals were played over two legs; in 1987 Charlton and Leeds United also needed a replay. Since 1990 the final has been a single match: 11 at the old Wembley, 6 at the Millennium Stadium in Cardiff from 2001 to 2006, and 20 at the new Wembley, which opened with Derby County's 1-0 win over West Bromwich Albion in 2007.
Finals are close. Of the 37 single-match finals, 15 ended 1-0, 24 were won by one goal, eight went to extra time and four to penalties. The highest-scoring was the 1998 final, when Charlton Athletic and Sunderland drew 4-4 and Charlton won the shoot-out 7-6. The higher-placed club has won 19 of the 37, 51 percent.
Crystal Palace have won the final four times, in 1989, 1997, 2004 and 2013, from five appearances. Hull City have won all three of their second-tier finals, in 2008, 2016 and 2026. Sheffield United have lost all four of theirs, the last in 2025.
| Final | Winner (place) | Score | Beaten finalist (place) | Venue |
|---|---|---|---|---|
| 2026 | Hull City (6th) | 1-0 | Middlesbrough (5th) | Wembley |
| 2025 | Sunderland (4th) | 2-1 | Sheffield United (3rd) | Wembley |
| 2024 | Southampton (4th) | 1-0 | Leeds United (3rd) | Wembley |
| 2023 | Luton Town (3rd) | 1-1 (6-5 pens) | Coventry City (5th) | Wembley |
| 2022 | Nottingham Forest (4th) | 1-0 | Huddersfield Town (3rd) | Wembley |
| 2021 | Brentford (3rd) | 2-0 | Swansea City (4th) | Wembley |
| 2020 | Fulham (4th) | 2-1 (aet) | Brentford (3rd) | Wembley |
| 2019 | Aston Villa (5th) | 2-1 | Derby County (6th) | Wembley |
| 2018 | Fulham (3rd) | 1-0 | Aston Villa (4th) | Wembley |
| 2017 | Huddersfield Town (5th) | 0-0 (4-3 pens) | Reading (3rd) | Wembley |
| 2016 | Hull City (4th) | 1-0 | Sheffield Wednesday (6th) | Wembley |
| 2015 | Norwich City (3rd) | 2-0 | Middlesbrough (4th) | Wembley |
| 2014 | Queens Park Rangers (4th) | 1-0 | Derby County (3rd) | Wembley |
| 2013 | Crystal Palace (5th) | 1-0 (aet) | Watford (3rd) | Wembley |
| 2012 | West Ham United (3rd) | 2-1 | Blackpool (5th) | Wembley |
| 2011 | Swansea City (3rd) | 4-2 | Reading (5th) | Wembley |
| 2010 | Blackpool (6th) | 3-2 | Cardiff City (4th) | Wembley |
| 2009 | Burnley (5th) | 1-0 | Sheffield United (3rd) | Wembley |
| 2008 | Hull City (3rd) | 1-0 | Bristol City (4th) | Wembley |
| 2007 | Derby County (3rd) | 1-0 | West Bromwich Albion (4th) | Wembley |
| 2006 | Watford (3rd) | 3-0 | Leeds United (5th) | Cardiff |
| 2005 | West Ham United (6th) | 1-0 | Preston North End (5th) | Cardiff |
| 2004 | Crystal Palace (6th) | 1-0 | West Ham United (4th) | Cardiff |
| 2003 | Wolverhampton Wanderers (5th) | 3-0 | Sheffield United (3rd) | Cardiff |
| 2002 | Birmingham City (5th) | 1-1 (4-2 pens) | Norwich City (6th) | Cardiff |
| 2001 | Bolton Wanderers (3rd) | 3-0 | Preston North End (4th) | Cardiff |
| 2000 | Ipswich Town (3rd) | 4-2 | Barnsley (4th) | Wembley |
| 1999 | Watford (5th) | 2-0 | Bolton Wanderers (6th) | Wembley |
| 1998 | Charlton Athletic (4th) | 4-4 (7-6 pens) | Sunderland (3rd) | Wembley |
| 1997 | Crystal Palace (6th) | 1-0 | Sheffield United (5th) | Wembley |
| 1996 | Leicester City (5th) | 2-1 (aet) | Crystal Palace (3rd) | Wembley |
| 1995 | Bolton Wanderers (3rd) | 4-3 (aet) | Reading (2nd) | Wembley |
| 1994 | Leicester City (4th) | 2-1 | Derby County (6th) | Wembley |
| 1993 | Swindon Town (5th) | 4-3 | Leicester City (6th) | Wembley |
| 1992 | Blackburn Rovers (6th) | 1-0 | Leicester City (4th) | Wembley |
| 1991 | Notts County (4th) | 3-1 | Brighton & Hove Albion (6th) | Wembley |
| 1990 | Swindon Town (4th) | 1-0 | Sunderland (6th) | Wembley |
The richest game in football: play-off winners in the Premier League
The final is often called the richest game in football: before the 2026 final, Deloitte estimated that the winner would earn at least £205 million more over three seasons, and more than £365 million if it avoided relegation in its first season.
Staying up is the harder part. Our study of every club promoted to the Premier League found that 14 of the 31 play-off winners from 1995-96 to 2025-26 survived their first season, 45 percent, against 35 of 61 clubs that went up automatically, 57 percent. By Championship place, the samples are small and the order is not neat:
- From 3rd: 6 of 12 stayed up, including Ipswich Town, fifth in 2000-01 with 66 points.
- From 4th: 2 of 7, Nottingham Forest in 2022-23 and Sunderland, seventh with 54 points last season.
- From 5th: 5 of 8, the best rate of the four places.
- From 6th: 1 of 4, West Ham United in 2005-06. Hull City are the fifth to try.
Hull are eighth in the Premier League table with 8 points from five games. All 14 promoted clubs since 1995-96 that took eight or more points from their first five games stayed up.
The 2026 final and the new Championship play-off format
Hull City finished sixth on 73 points, drew 0-0 at home to Millwall, third, and won the second leg 2-0. Southampton, fourth, beat Middlesbrough 2-1 on aggregate after extra time, then were expelled from the play-offs for filming other clubs' training and docked four points for this season, and Middlesbrough took their place. At Wembley on Saturday 23 May, Oli McBurnie scored in the 95th minute and Hull won 1-0.
From 2026-27 the play-offs take six clubs instead of four. As Sky Sports explains, fifth plays eighth and sixth plays seventh in one-leg eliminators at the home of the higher-placed club. The winners meet third and fourth in two-leg semi-finals, with third playing the lowest-placed club left, and the final is at Wembley. Eighth place has never been in the play-offs before, and seventh only in 1991.
Championship table 2026-27: the play-off race so far
As of 7 October 2026, 95 of the 552 league games have been played. Swansea City are top with 17 points, and only two points separate second-placed West Ham United from Bristol City in eighth, the last play-off place; Charlton Athletic are ninth on 12. Wolverhampton Wanderers, fourth, and Portsmouth have a game in hand. Sky Sports' table, last updated on 20 September, shows the same standings.
| Place | Club | Played | Points | Goal difference |
|---|---|---|---|---|
| 1 | Swansea City | 8 | 17 | +7 |
| 2 | West Ham United | 8 | 15 | +11 |
| 3 | Middlesbrough | 8 | 15 | +4 |
| 4 | Wolverhampton Wanderers | 7 | 14 | +5 |
| 5 | West Bromwich Albion | 8 | 14 | +2 |
| 6 | Queens Park Rangers | 8 | 13 | +3 |
| 7 | Stoke City | 8 | 13 | +1 |
| 8 | Bristol City | 8 | 13 | -1 |
| 9 | Charlton Athletic | 8 | 12 | -3 |
Southampton are 13th on 10 points after the deduction; with those four points they would be fourth. The regular season ends on Saturday 1 May 2027. On Vertize you can follow the Championship table and the fixtures, and play out the rest of the season in the Championship simulator. What the play-off places have cost in points is in our look at promotion in four second tiers.
Championship play-offs: frequently asked questions
Which league position wins the Championship play-offs most often? Third: 12 of the 36 finals between clubs placed third to sixth since 1989, against 9 for fourth, 9 for fifth and 6 for sixth.
Does playing the second leg at home help in the play-off semi-finals? A little: that club has gone through in 61 percent of semi-finals. Winning the first leg matters more, at 77 percent.
How many teams make the Championship play-offs in 2026-27? Six: the clubs from third to eighth, with one-leg eliminators for fifth to eighth before the two-leg semi-finals.
Do play-off winners stay up in the Premier League? Less often than the clubs promoted automatically: 45 percent since 1995-96, against 57 percent.
How this was built: every second-tier play-off from 1986-87 to 2025-26 (40 editions, 80 semi-finals and 40 finals), read from the season pages on Wikipedia through the MediaWiki API on 7 October 2026, with the finals checked against the list of finals. Results include extra time. League places come from the same pages (for 2015-16, rebuilt from football-data.co.uk results) and match the second-tier tables of our promoted-clubs study for every play-off winner since 1995. Premier League survival comes from that study, built on football-data.co.uk results. The 2026-27 tables are Sky Sports', read on 7 October 2026; the Championship one matches ours.