From the official starting grids and race results on formula1.com, we compared the grid slot and finishing position of each of the 8,639 drivers classified at the finish. A driver who started 12th and finished seventh changed five places, and so did one who went from seventh to 12th.
Positions gained and lost in F1, circuit by circuit
Across all 518 races, a classified driver finished an average of 3.2 places away from their grid slot, and 15 percent finished exactly where they started. The circuit moves that by about one place per driver, from 3.8 at Sepang, Albert Park and Hockenheim to 2.9 at Barcelona and 2.7 at Yas Marina and at Mexico City's Autódromo Hermanos Rodríguez. The gaps in the middle of the table are small, and with 10 to 28 races per circuit one chaotic Grand Prix can move an average, so read the ranking in groups.
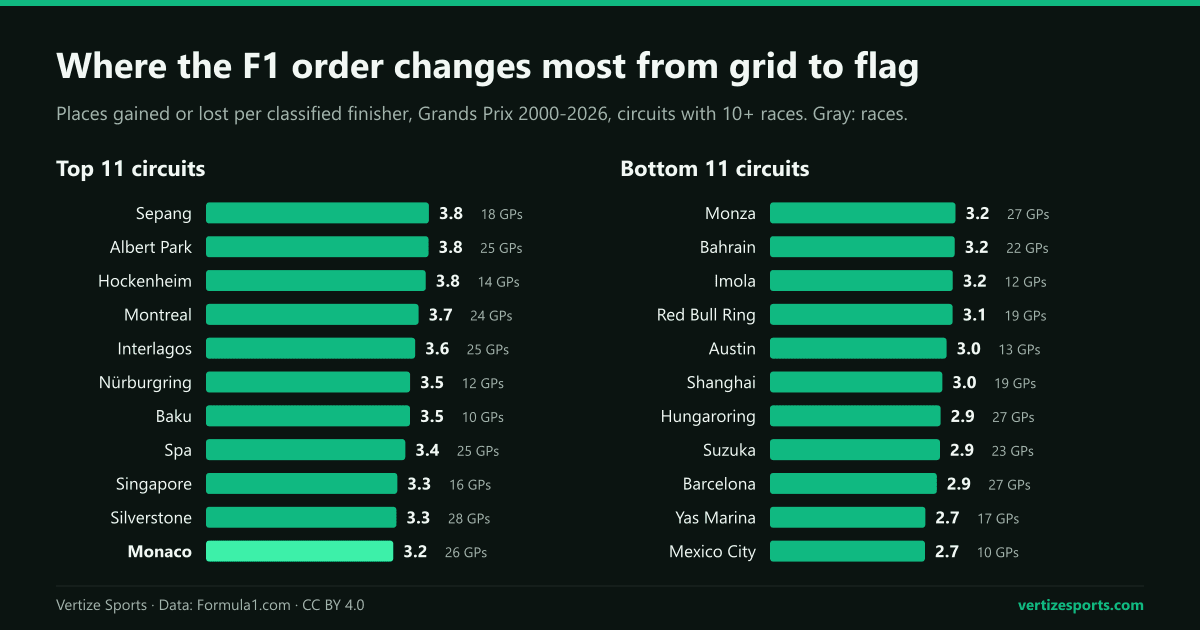
| Circuit | Grands Prix | Places changed | Reversed pairs | Winners from 4th or lower |
|---|---|---|---|---|
| Sepang (Malaysia) | 18 | 3.8 | 20.9% | 4 |
| Albert Park (Melbourne) | 25 | 3.8 | 21.7% | 3 |
| Hockenheim (Germany) | 14 | 3.8 | 22.0% | 2 |
| Gilles Villeneuve (Montreal) | 24 | 3.7 | 20.8% | 4 |
| Interlagos (São Paulo) | 25 | 3.6 | 21.9% | 4 |
| Nürburgring (Germany) | 12 | 3.5 | 19.9% | 2 |
| Baku City Circuit | 10 | 3.5 | 21.7% | 2 |
| Spa-Francorchamps | 25 | 3.4 | 20.4% | 5 |
| Marina Bay (Singapore) | 16 | 3.3 | 19.0% | 2 |
| Silverstone | 28 | 3.3 | 20.3% | 5 |
| Monaco | 26 | 3.2 | 17.3% | 0 |
| Monza | 27 | 3.2 | 18.6% | 6 |
| Bahrain (Sakhir) | 22 | 3.2 | 20.8% | 3 |
| Imola | 12 | 3.2 | 19.5% | 0 |
| Red Bull Ring (Austria) | 19 | 3.1 | 18.8% | 2 |
| Circuit of the Americas (Austin) | 13 | 3.0 | 18.9% | 2 |
| Shanghai | 19 | 3.0 | 17.4% | 3 |
| Hungaroring | 27 | 2.9 | 16.8% | 6 |
| Suzuka | 23 | 2.9 | 17.1% | 2 |
| Barcelona-Catalunya | 27 | 2.9 | 15.8% | 2 |
| Yas Marina (Abu Dhabi) | 17 | 2.7 | 17.0% | 1 |
| Hermanos Rodríguez (Mexico City) | 10 | 2.7 | 16.4% | 0 |
Why retirements inflate positions gained
A car that retires promotes everyone who was behind it. That is why the average finisher gained 1.6 places net: among finishers alone, every place gained is a place lost by another finisher, so the net gain comes entirely from cars that dropped out, did not start or were disqualified. The top four circuits in the table are among the six with the lowest finishing rates. At Albert Park only 68 percent of the cars in the results were classified, against 88 percent at Yas Marina; our count of DNFs has the rate for every season.
To take retirements out, we also counted reversed pairs: of every two drivers who both finished a race, we checked whether the one who started further back finished ahead. Retirements cannot inflate that share, and it does not grow with the size of the field. Across all races, 18.9 percent of pairs of finishers reversed their order. Hockenheim (22.0 percent), Interlagos (21.9) and Albert Park (21.7) have the most, and Barcelona (15.8), Mexico City (16.4) and the Hungaroring (16.8) the fewest.
For American fans: the Circuit of the Americas in Austin is 16th of 22 by places changed, at 3.0, and right at the overall average for reversed pairs. Miami, with five races, and Las Vegas, with three, are too new for the table, though Las Vegas has the highest share of reversed pairs of any circuit used since 2000, 31.0 percent.
Monaco overtaking and the hardest F1 track to pass on
Monaco sits 11th of 22 by places changed, at 3.2, helped by the fact that about one car in four there was not classified. By reversed pairs it drops to 17th, at 17.3 percent. Three more numbers make its case as the hardest track to pass on, and one goes the other way:
- No winner started lower than third in the 26 Monaco Grands Prix since 2000. Imola and Mexico City, with 12 and 10 races, are the only other circuits in the table where that is true.
- From 2011 to 2025, 14.4 percent of pairs of finishers reversed their order at Monaco, the lowest of the 24 circuits with at least five races in those years. Barcelona was next, at 14.9 percent.
- The 2024 Monaco Grand Prix changed fewer places than any other Grand Prix since 2000, 0.6 per finisher: 12 of the 16 finishers ended where they started, including the first ten.
- The 2026 race went the other way: 24.2 percent of pairs reversed, one of the four highest of the season, although the FIA had kept the new active wings shut for the whole weekend, leaving only Overtake Mode.
Winners from outside the top three, by circuit
Across the 22 circuits, Monza and the Hungaroring have had the most winners who started fourth or lower, six each, followed by Silverstone and Spa with five; Monaco, Imola and Mexico City have had none. The Hungaroring is the odd one out, near the bottom on both measures of reshuffling but level with Monza at the top of this count. How often pole wins at each circuit is in our analysis of pole position.
Overtaking before and after DRS
DRS arrived in 2011, formula1.com notes: the Drag Reduction System, a flap in the rear wing that a driver close behind another car could open on set straights, to give the chasing driver a better chance of overtaking. By places changed per finisher, the DRS years look calmer: 3.1 from 2011 to 2025, against 3.6 from 2000 to 2010. But far more cars finished, 85 percent of those in the results against 71 percent, or 17.7 per race instead of 15.0, and reversed pairs barely moved: 19.4 percent before DRS and 18.9 percent with it.
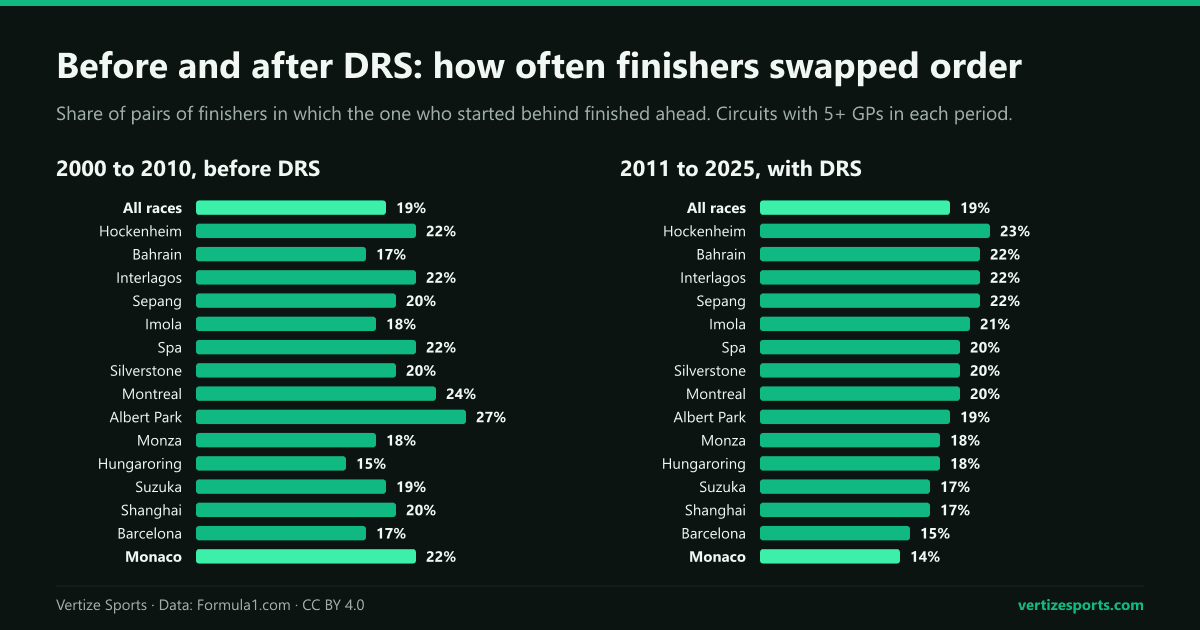
Circuit by circuit, the picture is mixed. Of the 15 circuits with at least five races in each period, reversed pairs rose at six, most at Bahrain, from 17.2 to 22.3 percent, and fell at nine, most at Albert Park, from 27.2 to 18.8, and Monaco, from 22.2 to 14.4. The season with the lowest share since 2000 was 2011, the first with DRS, at 15.1 percent. None of this proves DRS did not help passing: a result sheet cannot see a pass that is later undone.
Overtaking in 2026: the first season without DRS
This season DRS is gone. Under the 2026 rules the wings can open on designated straights for every driver, with no need to be within a second of anyone, and a driver within one second of the car ahead at the detection point gets extra electrical energy for the next lap. Formula1.com calls that Overtake Mode and describes it as the system that effectively replaces DRS; the details are in its guide to the new terms.
After 15 Grands Prix, run with 22 cars now that Cadillac has joined as an 11th team, finishers have changed 2.8 places each on average and 16.4 percent of pairs have reversed, lower than in either earlier period. Part of that is the calendar: the first Grand Prix at Madrid's Madring had the fewest reversals of the season, 5.2 percent. At the 14 circuits that also held races in the DRS years, 2026 stands at 17.3 percent against 18.3 percent there from 2011 to 2025, lower at nine and higher at five, Monaco and Barcelona among them.
| Grand Prix | Places changed | Reversed pairs | Same circuit, 2011-2025 |
|---|---|---|---|
| Australian GP | 3.1 | 16.7% | 18.8% (13) |
| Chinese GP | 2.7 | 12.4% | 16.6% (11) |
| Japanese GP | 2.0 | 11.1% | 16.6% (13) |
| Miami GP | 2.6 | 13.7% | 19.3% (4) |
| Canadian GP | 3.9 | 15.0% | 19.6% (13) |
| Monaco GP | 3.9 | 24.2% | 14.4% (14) |
| Barcelona GP | 3.1 | 22.1% | 14.9% (15) |
| Austrian GP | 1.7 | 10.5% | 19.6% (14) |
| British GP | 4.1 | 24.2% | 19.9% (16) |
| Belgian GP | 2.2 | 14.6% | 20.1% (15) |
| Hungarian GP | 1.8 | 12.3% | 18.3% (15) |
| Dutch GP | 2.2 | 16.2% | 23.3% (5) |
| Italian GP | 3.3 | 24.6% | 18.4% (15) |
| Spanish GP (Madrid) | 1.5 | 5.2% | New circuit |
| Azerbaijan GP | 4.2 | 25.8% | 21.3% (9) |
The most recent race was the most reshuffled: in Baku on September 26, 25.8 percent of pairs of finishers reversed their order. The Bahrain Grand Prix, next, is scheduled at Sepang in Malaysia on October 4; Sepang, the circuit at the top of our table, has not held a Grand Prix since 2017. The rest of the season is on the 2026 F1 schedule and the title race on the drivers' standings; our study of title comebacks shows how often a leader holds on.
F1 overtaking by circuit: frequently asked questions
Which F1 track has the most overtaking? By places changed between grid and finish, Sepang and Albert Park, 3.8 per classified driver since 2000. With retirements taken out, Hockenheim and Interlagos, where about 22 percent of pairs of finishers swapped order. Neither is a count of passes.
What is the hardest F1 track to overtake on? The order changes least at Mexico City and Yas Marina, 2.7 places per finisher, and, with retirements removed, at Barcelona. Monaco had the lowest share of reversed pairs of the circuits with five or more races from 2011 to 2025, and no winner there since 2000 started lower than third.
Did DRS increase overtaking in F1? Not in the start-to-finish order: reversed pairs were 19.4 percent from 2000 to 2010 and 18.9 percent from 2011 to 2025. Places changed per finisher fell as more cars reached the finish.
Is there DRS in F1 in 2026? No. It was replaced by wings every driver can open on designated straights and by Overtake Mode, extra electrical energy for a driver within one second of the car ahead. After 15 races, 16.4 percent of pairs of finishers have swapped order, against 18.9 percent in the DRS years.
How many places does an F1 driver gain in a race on average? A classified finisher gains 1.6 places net, all of them handed over by cars that were not classified, and ends 3.2 places from their grid slot counting gains and losses.
How this was built: every Formula 1 Grand Prix from the 2000 Australian Grand Prix to the 2026 Azerbaijan Grand Prix, 518 races, from the official starting grids and race results on formula1.com. Places changed is the gap between grid and finishing position of each of the 8,639 classified drivers; reversed pairs compares every two classified drivers of the same race. The 51 classified drivers missing from formula1.com's starting grid count as starting behind the last car listed; where the page explains it, they started from the pit lane. Circuits group every Grand Prix at the same venue. Sprints are not counted, and without lap data none of these figures is a count of overtakes.