Each conference gets one automatic bid, for the winner of its tournament; the rest of the field is chosen by the selection committee, 37 at-large teams in 2026. We matched all 2,694 teams in the 41 tournaments since 1985 with their conference and counted what each conference did with its bids. The six major conferences are the ACC, Big East, Big Ten, Big 12, SEC and, until its 2024 breakup, the Pac-12.
March Madness bids by conference in 2026
Eight conferences had more than one team last March. Behind the SEC, Big Ten, ACC and Big 12, which took 35 of the 68 places between them, the Big East and the West Coast Conference (WCC) had three each and the Atlantic 10 and the Mid-American Conference (MAC) two each. Of the 37 at-large bids, 33 went to the major conferences and four to the rest: the Saint Mary's Gaels and the Santa Clara Broncos of the WCC, the Saint Louis Billikens of the Atlantic 10 and the Miami (Ohio) RedHawks, the MAC's first at-large team since 1999.
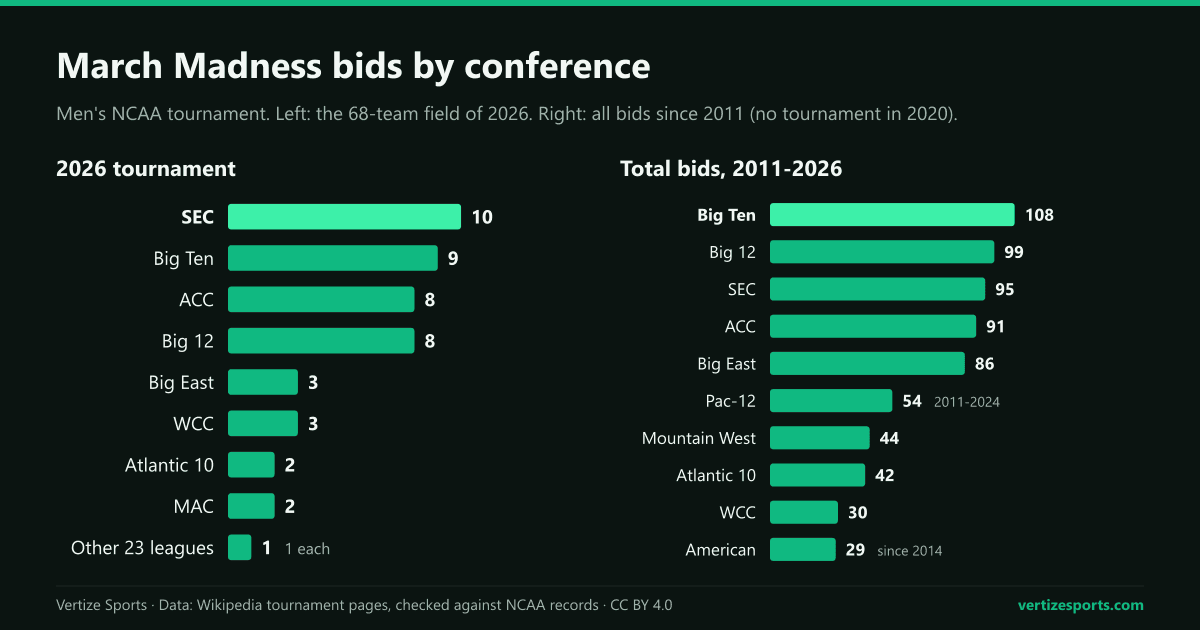
Bids and wins are different things. The Big Ten turned its nine bids into 21 wins, six Sweet 16 teams, two Final Four teams and the title, won by the Michigan Wolverines, the league's first since the Michigan State Spartans in 2000. The ACC's eight produced six wins and one Sweet 16 team, the Duke Blue Devils, and the SEC's 10 produced 14 wins and no Final Four team.
How many teams from each conference make March Madness, year by year
The table has every 68-team field. The six major conferences have filled between 26 and 33 of the 36 or 37 at-large places each year, and they took 33 in both 2025 and 2026, the most of the era.
| Year | SEC | Big Ten | Big 12 | ACC | Big East | Pac-12 | Other at-large | One-bid leagues |
|---|---|---|---|---|---|---|---|---|
| 2011 | 5 | 7 | 5 | 4 | 11 | 4 | 7 | 21 |
| 2012 | 4 | 6 | 6 | 5 | 9 | 2 | 11 | 19 |
| 2013 | 3 | 7 | 5 | 4 | 8 | 5 | 11 | 20 |
| 2014 | 3 | 6 | 7 | 6 | 4 | 6 | 10 | 22 |
| 2015 | 5 | 7 | 7 | 6 | 6 | 4 | 7 | 21 |
| 2016 | 3 | 7 | 7 | 7 | 5 | 7 | 6 | 23 |
| 2017 | 5 | 7 | 6 | 9 | 7 | 4 | 4 | 23 |
| 2018 | 8 | 4 | 7 | 9 | 6 | 3 | 5 | 23 |
| 2019 | 7 | 8 | 6 | 7 | 4 | 3 | 7 | 21 |
| 2021 | 6 | 9 | 7 | 7 | 4 | 5 | 5 | 20 |
| 2022 | 6 | 9 | 6 | 5 | 6 | 3 | 7 | 22 |
| 2023 | 8 | 8 | 7 | 5 | 5 | 4 | 5 | 23 |
| 2024 | 8 | 6 | 8 | 5 | 3 | 4 | 8 | 22 |
| 2025 | 14 | 8 | 7 | 4 | 5 | – | 4 | 24 |
| 2026 | 10 | 9 | 8 | 8 | 3 | – | 4 | 23 |
Outside those six, the at-large pool has shrunk. Teams from other conferences got 46 at-large bids in the first five tournaments of the era, from 2011 to 2015, and 28 in the last five, from 2022 to 2026, including four in each of the last two years, matching the low of 2017. Since 2011 the Mountain West has had the most at-large bids of any other league, 29, followed by the Atlantic 10 with 27, the American with 17 and the WCC with 15.
Most NCAA tournament bids by one conference
The SEC's 14 bids in 2025 are the record. In the first 64-team field, in 1985, the Big East and the Big Ten had six teams each, and the high mark has been raised four times since:
- 7: Big Ten, 1990. It was matched four times before anyone went higher, by the Big East in 1991 and by the Big Ten in 1994, 1999 and 2001.
- 8: Big East, 2006. The league did it again in 2008 and 2010.
- 11: Big East, 2011. It came in the first 68-team field, and the league had nine bids the next year.
- 14: SEC, 2025. Two of the 14, Texas and Oklahoma, had played in the Big 12 in their previous tournament trips; without them the SEC would still have had 12.
The SEC's 2025 teams won 23 games, the most by one conference in a tournament since 1985, and put seven in the Sweet 16, which no conference had done before. The Florida Gators won the title. The concentration showed at the other end: only seven conferences had more than one bid in 2025, the fewest since 1985, and 24 had one, the most. In 2026 the counts were eight and 23.
Conference realignment and March Madness bids since 2024
The Pac-12 had four bids in 2024 and none in 2025 or 2026, when it was down to two members, Oregon State and Washington State, under an NCAA two-year grace period. Its former teams kept making the field for other leagues: the Arizona Wildcats for the Big 12 and the Oregon Ducks and UCLA Bruins for the Big Ten in 2025, and Arizona and UCLA again in 2026, when Arizona reached the Final Four as a No. 1 seed.
The map moved again this summer. On July 1, 2026, Boise State, Colorado State, Fresno State, Gonzaga, San Diego State, Texas State and Utah State joined Oregon State and Washington State in a nine-team Pac-12. Those nine schools had 16 bids in the last four tournaments, the same count the league gives: four in 2023, six in 2024, four in 2025 and two in 2026, all but one of them as Mountain West or WCC members. The Mountain West, which had six bids in 2024, had one in 2026.
NCAA tournament wins by conference since 2011
From 2011 to 2026 the ACC won 1.63 games per bid, the best rate of any conference, and the Big Ten won the most games, 159, but only one title, Michigan's in 2026. The Big East had fewer bids than any other current major conference, 86, and the most titles, six: the UConn Huskies in 2011, 2023 and 2024, the Villanova Wildcats in 2016 and 2018 and the Louisville Cardinals in 2013, a title the NCAA later vacated.
| Conference | Bids | Record | Wins per bid | Sweet 16 | Final Four | Titles | Vs. seed |
|---|---|---|---|---|---|---|---|
| ACC | 91 | 148-88 | 1.63 | 41 | 10 | 3 | 106% |
| Big Ten | 108 | 159-107 | 1.47 | 42 | 10 | 1 | 106% |
| SEC | 95 | 139-93 | 1.46 | 38 | 10 | 2 | 110% |
| Big East | 86 | 116-80 | 1.35 | 26 | 10 | 6 | 98% |
| Big 12 | 99 | 132-97 | 1.33 | 34 | 8 | 2 | 86% |
| Pac-12 | 54 | 71-54 | 1.31 | 22 | 2 | 0 | 109% |
| WCC | 30 | 39-30 | 1.30 | 9 | 2 | 0 | 92% |
| Missouri Valley | 20 | 22-20 | 1.10 | 4 | 2 | 0 | 127% |
| American | 29 | 27-28 | 0.93 | 6 | 2 | 1 | 92% |
| Atlantic 10 | 42 | 29-41 | 0.69 | 4 | 0 | 0 | 85% |
| Mountain West | 44 | 24-44 | 0.55 | 6 | 1 | 0 | 69% |
| Other 21 leagues | 322 | 98-322 | 0.30 | 8 | 3 | 0 | 107% |
Seeds explain much of the gap between conferences, because the major conferences get the better ones. So we also compared each team's wins in the 64-team bracket with the average for its seed line since 1985, the same records as in our March Madness seed records. SEC teams won 136 games against 124 expected, 110 percent, and the ACC and Big Ten 106 percent each. The Big 12 is the outlier among the majors: 131 wins against 152 expected, 86 percent, or 21 short.
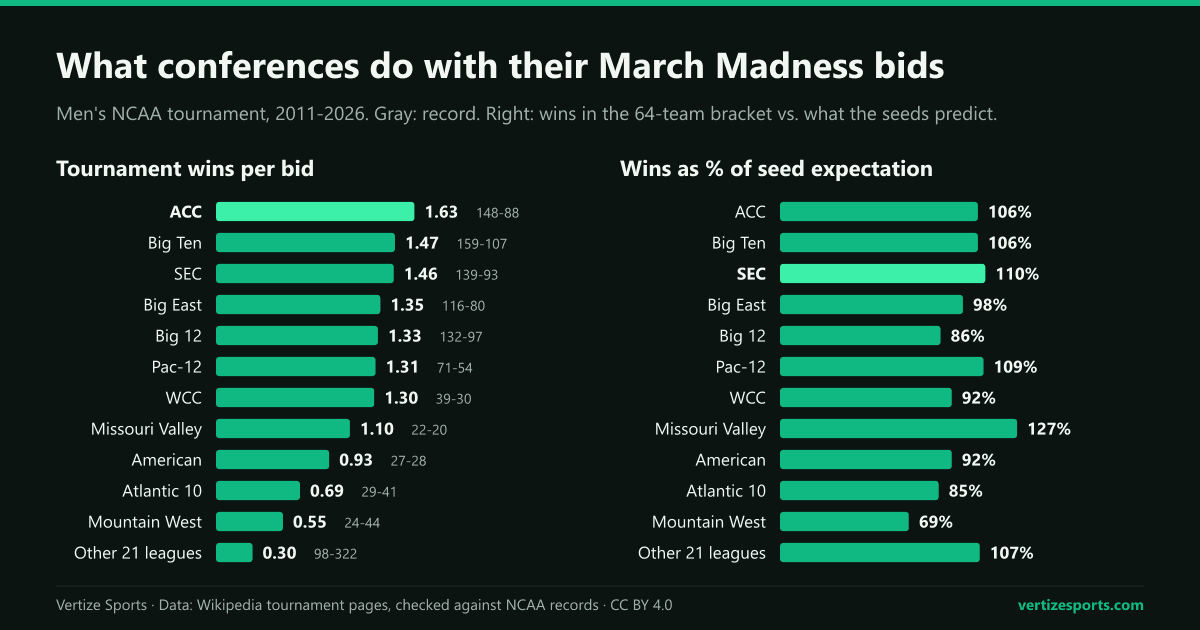
Among the other leagues, the Missouri Valley has beaten its seeds, 20 wins against 16 expected, and the Mountain West has fallen further short than any conference in the table: 23 wins against 33, 69 percent, and one Final Four, by the San Diego State Aztecs in 2023. The other 21 conferences, whose 322 bids were almost all automatic (314), won 98 games, 0.30 per bid, and slightly beat their seeds in the 64-team bracket, 65 wins against 61 expected. They reached three Final Fours: the Butler Bulldogs and VCU Rams in 2011 and the Florida Atlantic Owls in 2023.
The 2027 NCAA tournament: 76 teams and 44 at-large bids
The next tournament is the first with 76 teams: 32 automatic qualifiers and 44 at-large teams, one and seven more than in 2026, with no limit on how many come from one conference. The 12 lowest-seeded at-large teams and the 12 lowest-seeded automatic qualifiers start in a 12-game Opening Round on March 16 and 17 in Dayton and Wichita, and at-large teams only play at-large teams.
History suggests the new places will be more mixed than the at-large field as a whole, because they go to the teams just below the old cut line. Of the 60 at-large teams that played in the First Four from 2011 to 2026, the last four in each year, 36 came from the six major conferences and 24 from 11 other leagues, seven of them from the Mountain West.
The NCAA counts a similar split among the 60 teams it named as its first four out in those years: 35 from the ACC, Big Ten, Big 12, SEC and old Pac-12, three from the Big East and 22 from 12 other leagues. Near the cut line, about four teams in 10 have come from outside the majors, roughly twice their 18 percent share of all at-large bids, although six of the eight last-four-in teams of 2025 and 2026 came from major conferences.
The 2026-27 season tips off on Nov. 1, Selection Sunday is March 14 and the Final Four is April 3 and 5 at Ford Field in Detroit. Until then, the college basketball rankings show the AP Top 25 and the coaches poll as they stand, and the college basketball schedule lists every game with a Top 25 team, night by night, all part of the college basketball section. How often the preseason favorite finishes the job is in our look at the AP preseason No. 1.
March Madness bids by conference: frequently asked questions
How many teams from each conference make March Madness? It changes every year. In 2026 the SEC had 10 teams, the Big Ten nine, the ACC and Big 12 eight each, the Big East and WCC three each, the Atlantic 10 and MAC two each, and the other 23 conferences one each, their automatic qualifier.
What is the most bids one conference has received? Fourteen, by the SEC in 2025. The previous high was 11, by the Big East in 2011.
Which conference has the most NCAA tournament wins? Since 2011, the Big Ten, with 159, while the ACC has won the most per bid, 1.63, and the Big East the most titles, six. Since the field went to 64 teams in 1985, the ACC leads with 400 wins and 11 titles.
How many at-large bids are in the 2027 NCAA tournament? Forty-four, up from 37 in 2026, alongside 32 automatic qualifiers in a field of 76.
How many conferences are one-bid leagues? In 2026, 23 of the 31 conferences sent only their automatic qualifier. In 2025 it was 24, the most since the field went to 64 teams in 1985.
How this was built: every team in the 41 men's NCAA tournaments from 1985 to 2026 (none in 2020), with its conference and, from 1991, its type of bid, read by our own script from the team tables on Wikipedia's page for each tournament (2026 here), and every game from the same pages' brackets. Renamed leagues count as one (the Pac-10 became the Pac-12 in 2011), as does the Big East before and after its 2013 split. Records include First Four games; the seed comparison uses only the 64-team bracket, against each seed line's average wins from 1985 to 2026. Results count as played, including games the NCAA later vacated. Our bids and records by conference match the NCAA's own tables for 1985 to 2005, in its 2006 Final Four Records Book, once one Wikipedia error is fixed (Evansville was not yet in the Missouri Valley in 1989), and Wikipedia's record-by-conference tables for 2004 to 2026; our 2025 and 2026 automatic qualifiers match NCAA.com's lists.