We added up the regular-season stolen bases and caught stealing of every American and National League team in MLB's Stats API, every season from 1901 to 2026. Steals per game means per team, as with runs per game. An attempt is a steal or a caught stealing, and the success rate is steals divided by attempts. Stolen bases are complete from 1901, but caught stealing is missing for most teams before 1951, the same starting point MLB.com uses for success rates.
MLB stolen bases per game by decade
Steals were most common at the start of the 20th century: 1.18 per team per game from 1901 to 1909 and 1.17 in the 1910s. The rate halved in the 1920s, to 0.59, and kept falling to 0.30 in the 1950s. The 1950 season had the fewest of any since 1901, 0.26 a game.
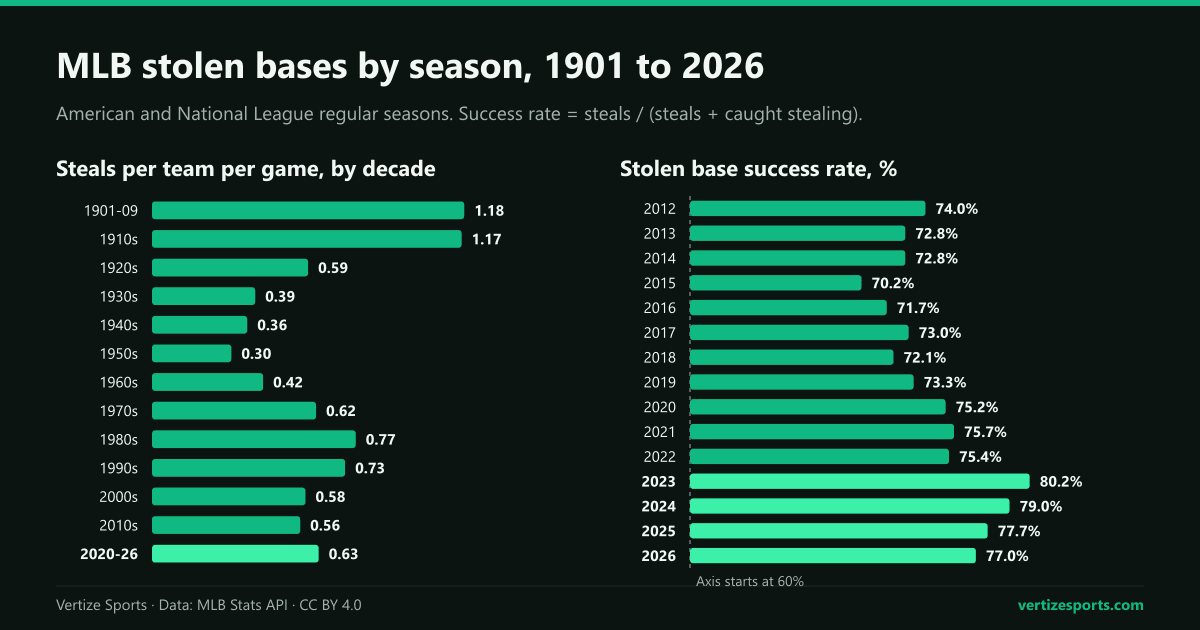
The running game came back in the 1970s and peaked in the 1980s, at 0.77 steals per team per game. The 1987 season had 0.85, the most of any season since 1951, with 2.43 attempts per game by the two teams. Steals then declined for three decades, to 0.56 a game in the 2010s, and 2021 had 0.46, the fewest since 1971.
| Seasons | Steals per game | Attempts per game | Success rate |
|---|---|---|---|
| 1901-09 | 1.18 | n/a | n/a |
| 1910s | 1.17 | n/a | n/a |
| 1920s | 0.59 | n/a | n/a |
| 1930s | 0.39 | n/a | n/a |
| 1940s | 0.36 | n/a | n/a |
| 1950s | 0.30 | 0.52 | 58.1% |
| 1960s | 0.42 | 0.67 | 62.5% |
| 1970s | 0.62 | 0.97 | 64.2% |
| 1980s | 0.77 | 1.13 | 67.7% |
| 1990s | 0.73 | 1.06 | 68.3% |
| 2000s | 0.58 | 0.81 | 70.7% |
| 2010s | 0.56 | 0.77 | 72.5% |
| 2020-26 | 0.63 | 0.81 | 77.6% |
Stolen base success rate by year since 1951
Teams run less than they did in the 1980s, but they are thrown out far less often. Runners were safe 58.1 percent of the time in the 1950s, 67.7 percent in the 1980s, 70.7 in the 2000s and 72.5 in the 2010s, a rise in every decade since the 1950s. The 2020s so far stand at 77.6 percent.
Every season from 2020 to 2026 had a higher success rate than any season before 2020, when the best was 74.4 percent in 2007. Part of that climb came before the new rules: in April 2023, MLB.com's Mike Petriello cited work by Tom Tango, MLB's senior data analyst, showing that runners had been getting better at picking their spots to run.
The break-even success rate for stealing bases
A caught stealing hurts more than a stolen base helps, since it takes a runner off the bases and adds an out. MLB.com's glossary gives a rule of thumb: a base stealer who succeeds at least 75 percent of the time is typically helping the team by running. By that yardstick, the league as a whole fell short in every season from 1951 to 2019 and has cleared it every season since, starting with 75.2 percent in 2020.
That trade-off helps explain the long decline. In 1987 teams tried a steal on 12.5 percent of the times a batter reached first with a single, a walk or a hit by pitch, the highest rate since 1951, but succeeded only 70.1 percent of the time. By 2021 attempts were down to 6.8 percent of those chances, the lowest since 1964, and the success rate was up to 75.7 percent.
How the 2023 rule changes revived the stolen base
MLB's 2023 rule changes included two aimed squarely at the running game, along with the pitch timer:
- Bigger bases: 18 inches square instead of 15, which cut 4.5 inches from the distance between first and second and between second and third.
- A limit on disengagements: a pitcher may make two pickoff attempts or step-offs per plate appearance. A third pickoff attempt that fails is a balk, and the runner moves up a base; the limit resets when a runner advances.
- The pitch timer: 15 seconds between pitches with the bases empty and 20 with runners on, cut to 18 with runners on in 2024. Its effect on game times is in our MLB game length study.
The effect was immediate. Steals rose 41 percent in 2023, from 2,486 to 3,503, and attempts 33 percent; counting both teams, attempts went from 1.4 a game to 1.8, as MLB.com also counted. The success rate jumped from 75.4 percent to 80.2, the highest since 1951. Per team, steals went from 0.51 to 0.72 a game, the same year scoring rose, as our study of MLB runs per game by season shows.
Runners stole 3,617 bases in 2024, 0.74 per team per game, the most per game since 1992 (0.77) and the highest total of any AL and NL season since at least 1901. MLB.com, which also counts the Federal League, called it the most in 109 years. Steals have eased since, to 3,440 in 2025 and 3,289 in 2026, and the success rate has slipped each year, to 79.0, 77.7 and 77.0 percent.
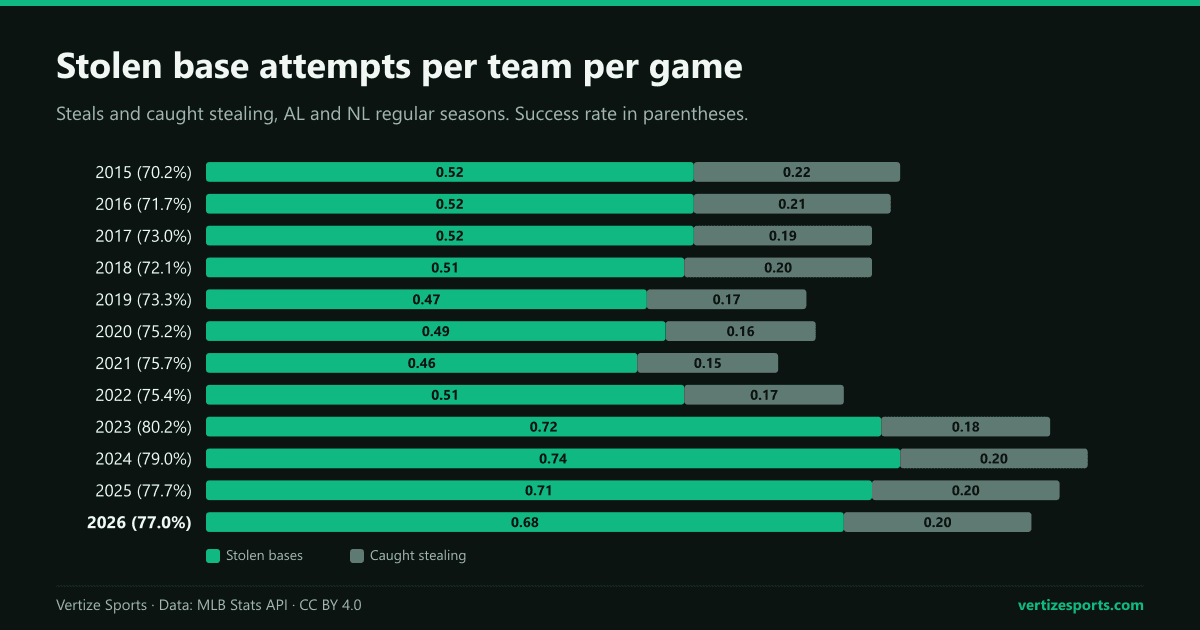
Attempts in 2026, 1.76 a game by both teams, were the fewest since 2022 but more than in any season from 2013 to 2022. Counted against the times a batter reached first, teams ran on 9.6 percent of chances in 2026, against 10.7 in 2024 and 12.5 in 1987, so the running game is busier than a decade ago but still short of the 1980s.
Teams with the most stolen bases in 2026
The 2026 regular season ended on Sunday, September 27, and every result is on the MLB schedule. Runners stole 3,289 bases and were caught 984 times in 2,429 games.
- Most steals: the Washington Nationals, 178, safe 81.7 percent of the time in a 77-85 season. Their Nasim Nuñez led the majors with 49, ahead of Chandler Simpson of the Tampa Bay Rays (46) and Bobby Witt Jr. of the Kansas City Royals (45).
- Next: the Tampa Bay Rays (98-64) and San Diego Padres (91-71) with 164 each, the Miami Marlins with 163 and the Milwaukee Brewers with 162, whose 103-59 record was the best in the majors.
- Fewest: the Houston Astros, 50, and the Detroit Tigers, 58. The Los Angeles Dodgers stole 72 and won 100 games.
- Best success rate: the Philadelphia Phillies, 105 steals in 124 attempts, or 84.7 percent. The Astros had the lowest, 69.4 percent, and 11 of the 30 teams were under 75 percent.
The individual leaders come from MLB's Stats API. The postseason is on the 2026 MLB playoff bracket.
Do stolen bases help teams win?
Not much on their own, at least over a team's season. We compared each of the 1,936 team-seasons since 1951 with the league average of its own season. The correlation between steals per game and runs per game, on a scale from -1 to 1, is 0.04, close to none, and between steals and winning percentage 0.14. Runs per game and winning percentage correlate at 0.67.
Success rate tracks winning better than volume does, at 0.24. Since the 2023 rule changes, the 30 team-seasons with the most steals, 139 or more, won 52.1 percent of their games and scored 4.57 runs a game; the 30 with the fewest, 87 or fewer, won 48.4 percent and scored 4.39.
None of this shows that steals cause wins. Teams that reach base more have more chances both to run and to score, and good teams may choose to run more or less for reasons of their own. For how runs turn into wins, see our run differential analysis.
MLB stolen bases by season since 2000
| Season | Steals | Caught stealing | Steals per game | Attempts per game | Success rate |
|---|---|---|---|---|---|
| 2026 | 3,289 | 984 | 0.68 | 0.88 | 77.0% |
| 2025 | 3,440 | 989 | 0.71 | 0.91 | 77.7% |
| 2024 | 3,617 | 961 | 0.74 | 0.94 | 79.0% |
| 2023 | 3,503 | 866 | 0.72 | 0.90 | 80.2% |
| 2022 | 2,486 | 811 | 0.51 | 0.68 | 75.4% |
| 2021 | 2,213 | 711 | 0.46 | 0.60 | 75.7% |
| 2020 | 885 | 292 | 0.49 | 0.66 | 75.2% |
| 2019 | 2,280 | 832 | 0.47 | 0.64 | 73.3% |
| 2018 | 2,474 | 958 | 0.51 | 0.71 | 72.1% |
| 2017 | 2,527 | 934 | 0.52 | 0.71 | 73.0% |
| 2016 | 2,537 | 1,001 | 0.52 | 0.73 | 71.7% |
| 2015 | 2,505 | 1,064 | 0.52 | 0.73 | 70.2% |
| 2014 | 2,764 | 1,035 | 0.57 | 0.78 | 72.8% |
| 2013 | 2,693 | 1,007 | 0.55 | 0.76 | 72.8% |
| 2012 | 3,229 | 1,136 | 0.66 | 0.90 | 74.0% |
| 2011 | 3,279 | 1,261 | 0.67 | 0.93 | 72.2% |
| 2010 | 2,959 | 1,129 | 0.61 | 0.84 | 72.4% |
| 2009 | 2,970 | 1,133 | 0.61 | 0.84 | 72.4% |
| 2008 | 2,799 | 1,035 | 0.58 | 0.79 | 73.0% |
| 2007 | 2,918 | 1,002 | 0.60 | 0.81 | 74.4% |
| 2006 | 2,767 | 1,110 | 0.57 | 0.80 | 71.4% |
| 2005 | 2,565 | 1,069 | 0.53 | 0.75 | 70.6% |
| 2004 | 2,589 | 1,100 | 0.53 | 0.76 | 70.2% |
| 2003 | 2,573 | 1,132 | 0.53 | 0.76 | 69.4% |
| 2002 | 2,750 | 1,282 | 0.57 | 0.83 | 68.2% |
| 2001 | 3,103 | 1,408 | 0.64 | 0.93 | 68.8% |
| 2000 | 2,924 | 1,323 | 0.60 | 0.87 | 68.8% |
MLB stolen bases: frequently asked questions
How many stolen bases are there per MLB game? In the 2026 regular season, 0.68 per team per game, or about 1.35 for both teams together, from 1.76 attempts per game by the two teams.
What is a good stolen base success rate? MLB.com's rule of thumb is 75 percent: above that, a runner is usually helping the team. The league average was 77.0 percent in 2026 and has been above 75 percent every season since 2020.
Which MLB season had the most stolen bases? Among AL and NL seasons since 1901, 2024, with 3,617. Per team per game, the 1901-09 seasons averaged 1.18, and the most since 1951 was 0.85 in 1987.
Why did stolen bases go up in 2023? Bigger bases shortened the distance between first and second and between second and third, and pitchers were limited to two pickoff attempts or step-offs per plate appearance. Steals rose 41 percent that season and the success rate reached 80.2 percent.
How this was built: stolen bases, caught stealing, runs and times on first (singles, walks and hit batters) are the regular-season batting totals of every AL and NL team in MLB's Stats API for every season from 1901 to 2026; Federal League and Negro Leagues teams are left out. Steals per game divide by team games; attempts are steals plus caught stealing. Success rates start in 1951, the first season with caught stealing for every team. Correlations compare each team-season with its season's average. Our 2023 and 2024 totals match MLB.com's. The 2026 figures cover the complete regular season, March 25 to September 27, as recorded on October 13.