We added up the regular-season pitching totals of every AL and NL team in MLB's Stats API, split by the API into innings thrown as a starter and as a reliever, and the season lines of every pitcher. Innings per start is starters' innings divided by starts. The splits cover every start from 1908; earlier seasons miss a few dozen starts each, so the series begins there.
Average innings per start by season since 1908
From 1908 to 1919, starters averaged 7.39 innings and faced about 30 batters a start. The figure fell in every decade except one: 7.06 in the 1920s, 6.52 in the 1950s and 6.40 in the 1960s. The 1970s were the exception, at 6.50, when starts rose from 6.40 innings in 1970 to 6.64 in 1971, a season with 1,083 complete games.
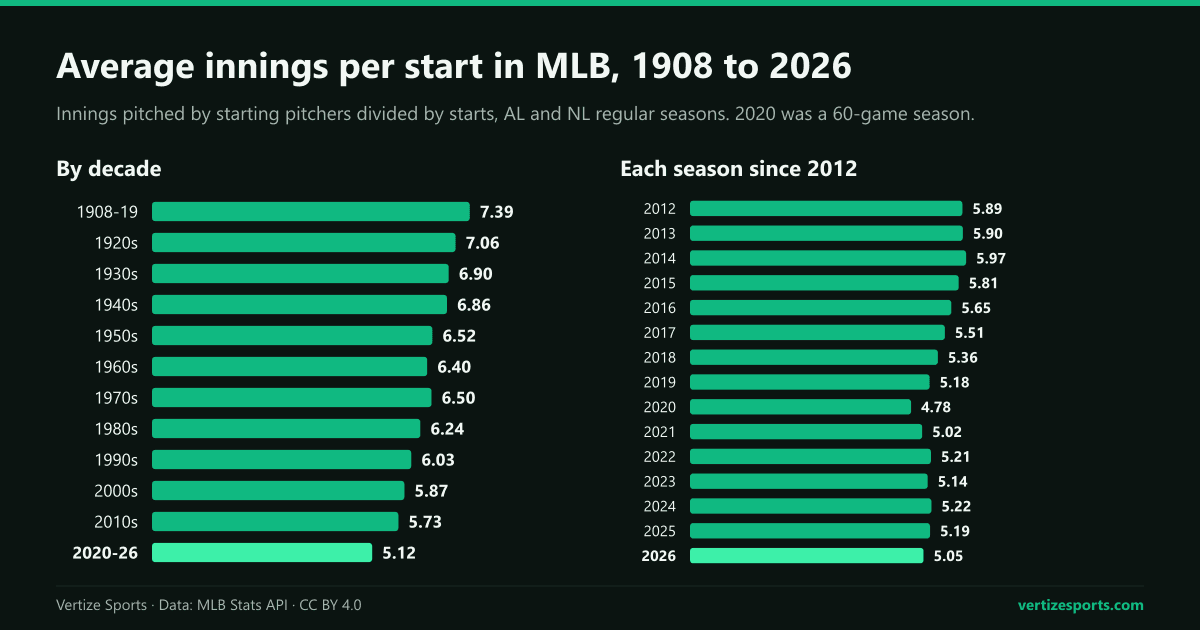
The slide resumed in the 1980s, at 6.24, and in the 1990s, at 6.03. The last season in which starters averaged six innings was 2011, at 6.03. From there the drop sped up: 5.81 innings in 2015, 5.51 in 2017 and 5.18 in 2019, then a low of 4.78 in the 60-game 2020 season and 5.02 in 2021, the lowest of any full season.
| Seasons | Innings per start | Complete-game rate | Bullpen share of innings | Pitchers per team per game |
|---|---|---|---|---|
| 1908-19 | 7.39 | 58.3% | 17.5% | 1.56 |
| 1920s | 7.06 | 49.6% | 20.9% | 1.80 |
| 1930s | 6.90 | 44.6% | 22.3% | 1.90 |
| 1940s | 6.86 | 42.6% | 23.2% | 2.00 |
| 1950s | 6.52 | 33.5% | 27.1% | 2.30 |
| 1960s | 6.40 | 25.2% | 28.7% | 2.55 |
| 1970s | 6.50 | 25.3% | 27.6% | 2.46 |
| 1980s | 6.24 | 15.6% | 30.4% | 2.72 |
| 1990s | 6.03 | 7.4% | 32.5% | 3.34 |
| 2000s | 5.87 | 3.6% | 34.1% | 3.76 |
| 2010s | 5.73 | 2.1% | 35.9% | 4.09 |
| 2020-26 | 5.12 | 0.7% | 42.1% | 4.31 |
MLB complete games by year
In 1908, starters completed 1,676 games, 67 percent of their starts. 1922 was the last season in which more than half of starts were complete games, at 50.2 percent, and the complete-game rate fell to 33.5 percent in the 1950s, 15.6 in the 1980s and 7.4 in the 1990s.
- 1978 was the last season with at least 1,000 complete games, 1,034 among 26 teams.
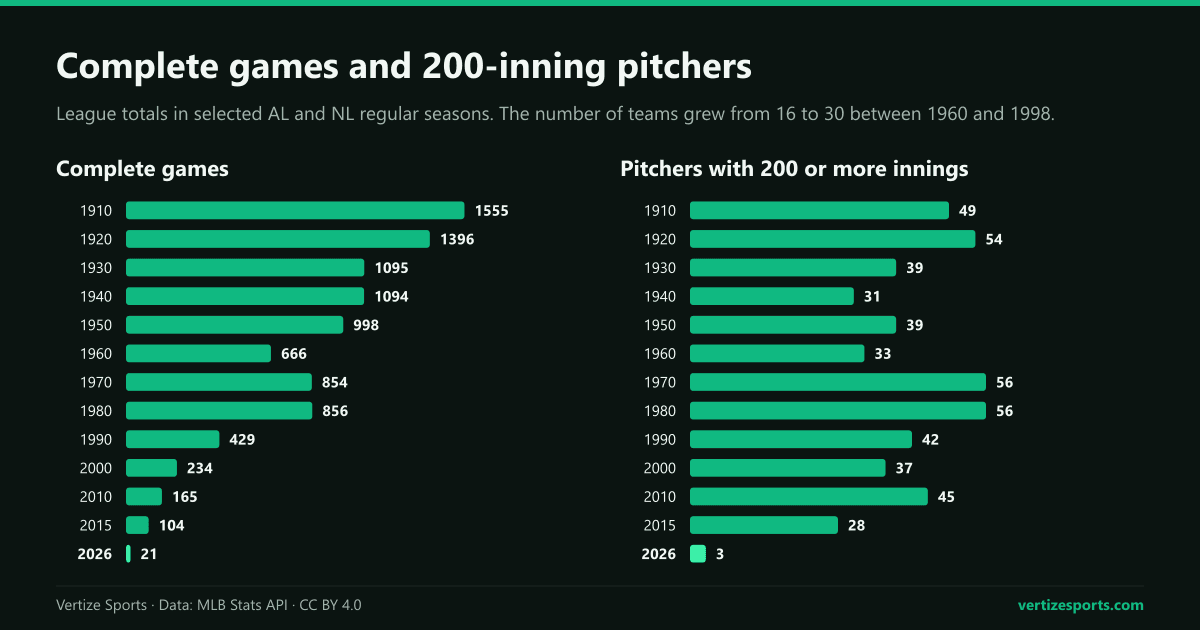
- 2015 was the last with at least 100: 104. There were 234 in 2000 and 165 in 2010.
- The count fell to 83 in 2016, 59 in 2017 and 42 in 2018.
- 2026 had 21, below the 29 of the 60-game 2020 season, and the fewest complete-game shutouts since 1908, 11, against a high of 295 in 1972.
200-inning pitchers and 20-game winners
The 200-inning season is now rare. In 1908, 52 pitchers reached 200 innings; the peak was 65, among 24 teams in 1974, and 56 still did it in 1980 and 37 in 2000. The count was 45 in 2010 and 28 in 2015, then nearly halved to 15 in 2016. In 2025 and 2026 only three pitchers reached 200 innings, the fewest of any full season since 1908.
Twenty-game winners have followed. Every season from 1901 to 1980 had at least one; 1981, shortened by a strike, was the first without. The last was Spencer Strider of the Atlanta Braves, with 20 wins in 2023, and 2026 was the third straight season without one, the longest such run since 1901. The 2026 leaders had 18: Cristopher Sánchez of the Philadelphia Phillies and Sonny Gray of the Boston Red Sox.
Bullpen share of innings and pitchers used per game
Relievers threw 13.8 percent of all innings in 1908, 24.4 percent in 1950, 29.6 in 1980 and 33.5 in 2000. The share reached 35.0 percent in 2015, 42.1 in 2019 and 44.5 in 2020. In 2026 it was 43.1 percent, up from 41.5 in 2025 and the highest of any full season.
Teams also use more pitchers each game. A team used 1.40 pitchers a game in 1908, 2.12 in 1950, 2.56 in 1980 and 3.54 in 2000, counting position players who pitched. The peak was 4.43 in both 2020 and 2021. Starters also face fewer batters: 26.0 a start in 2000 and 21.4 in 2026, on 96.8 pitches then and 83.2 now. More of those batters strike out, as our study of MLB strikeouts by season shows.
The opener era since 2018
On May 19, 2018, the Tampa Bay Rays started Sergio Romo, a reliever who had made 588 appearances without a start, against the Los Angeles Angels. It was the start of the opener: a reliever pitches the first inning or two, then hands the ball to a pitcher who would usually start. MLB.com counted 55 games with an opener for the Rays that season and put their relievers' share of innings at 56.2 percent, a major league record.
In our data the 2018 Rays' bullpen threw 56.9 percent of the team's innings, the highest of any team since 1908, and their starters averaged 3.85 innings. No team's bullpen had thrown half its innings in any season from 1908 to 2017. Since then it has happened to one team in 2018, three in 2019 and five in the 60-game 2020 season, none from 2021 to 2025, and two in 2026: the Chicago White Sox, at 53.2 percent, and the Washington Nationals.
League-wide, innings per start fell from 5.51 in 2017 to 5.36 in 2018 and 5.18 in 2019. Two rule changes followed, both in MLB's 2020 rule changes:
- The three-batter minimum, from 2020: every pitcher, starters included, must face at least three batters or finish the half-inning, unless hurt or ill. MLB said it could affect teams that use openers.
- A limit of 13 pitchers on the 26-man active roster, announced for 2020, delayed by the COVID-19 pandemic and enforced from June 20, 2022, the Associated Press reported.
Pitchers used per game did not fall after the three-batter minimum arrived: 4.41 in 2019, 4.43 in 2021. In 2022, the year the 13-pitcher limit took effect, it fell to 4.30, and to 4.24 in 2023, the fewest since 2017, while starters went 5.21 innings a start, up from 5.02. Those gains have not held: innings per start were 5.22 in 2024, 5.19 in 2025 and 5.05 in 2026. The pitch clock, introduced in 2023, is covered in our analysis of MLB game length.
Do teams whose starters pitch deeper win more?
Yes, on average, though the arrow points both ways: good starters last longer, and teams that are behind tend to go to the bullpen sooner. From 2015 to 2026, leaving out 2020, the 10 teams with the most innings per start each season had a .544 winning percentage, about 88.1 wins over 162, and the 10 with the fewest .469, about 76.0. In each of five periods since 1908 (1908-49, 1950-79, 1980-99, 2000-14 and 2015-26), the correlation between a team's innings per start, against that season's average, and its winning percentage was between 0.39 and 0.50.
It is a tendency, not a rule. In 2026 the correlation was only 0.18. The Milwaukee Brewers had the best record, 103-59, with starters averaging 4.98 innings, 21st of 30 teams, and the San Diego Padres won 91 games with the fourth-fewest innings per start, 4.65. The Seattle Mariners' starters went deepest, 5.62 innings, in a 76-86 season, while the Los Angeles Dodgers, 100-62, ranked third at 5.43.
MLB starting pitchers in 2026
The 2026 regular season ran from March 25 to September 27; every result is on the MLB schedule. Starters averaged 5.05 innings, down from 5.19 in 2025 and the second-lowest of any full season after 2021, on 83.2 pitches, down from 85.0.
- Complete games: 21, or 0.4 percent of starts, each by a different pitcher, the only season since 1908 in which no pitcher threw more than one.
- 200 innings: Sandy Alcantara of the Miami Marlins, 214; Cristopher Sánchez of the Phillies, 207; and Michael Wacha of the Kansas City Royals, 200 2/3.
- Pitchers used: 4.28 per team per game, and relievers threw 43.1 percent of the innings.
Each club's final record is in the MLB season simulator, and the postseason is on the 2026 MLB playoff bracket. For the scoring side of the same seasons, see MLB runs per game by season.
MLB starting pitching by season since 2010
| Season | Innings per start | Pitches per start | Complete games | Bullpen share | Pitchers per game | 200-inning pitchers | 20-game winners |
|---|---|---|---|---|---|---|---|
| 2026 | 5.05 | 83.2 | 21 | 43.1% | 4.28 | 3 | 0 |
| 2025 | 5.19 | 85.0 | 29 | 41.5% | 4.29 | 3 | 0 |
| 2024 | 5.22 | 85.5 | 28 | 41.2% | 4.26 | 4 | 0 |
| 2023 | 5.14 | 85.1 | 35 | 42.0% | 4.24 | 5 | 1 |
| 2022 | 5.21 | 84.9 | 36 | 41.3% | 4.30 | 8 | 1 |
| 2021 | 5.02 | 82.7 | 50 | 42.7% | 4.43 | 4 | 1 |
| 2020 | 4.78 | 80.3 | 29 | 44.5% | 4.43 | 0 | 0 |
| 2019 | 5.18 | 86.4 | 45 | 42.1% | 4.41 | 15 | 2 |
| 2018 | 5.36 | 88.1 | 42 | 40.1% | 4.36 | 13 | 2 |
| 2017 | 5.51 | 91.5 | 59 | 38.1% | 4.22 | 15 | 0 |
| 2016 | 5.65 | 92.6 | 83 | 36.7% | 4.15 | 15 | 3 |
| 2015 | 5.81 | 93.1 | 104 | 35.0% | 4.11 | 28 | 2 |
| 2014 | 5.97 | 95.6 | 118 | 33.5% | 3.98 | 34 | 3 |
| 2013 | 5.90 | 95.3 | 124 | 34.3% | 3.95 | 36 | 1 |
| 2012 | 5.89 | 94.9 | 127 | 34.0% | 3.99 | 31 | 4 |
| 2011 | 6.03 | 96.9 | 173 | 32.7% | 3.86 | 39 | 3 |
| 2010 | 5.98 | 97.0 | 165 | 32.9% | 3.87 | 45 | 3 |
MLB starting pitchers: frequently asked questions
How many innings does an MLB starter pitch on average? 5.05 innings per start in the 2026 regular season, against 5.92 in 2000 and 7.69 in 1908. The last season with an average of six innings was 2011.
How many complete games were there in MLB in 2026? 21, by 21 different pitchers, the fewest of any AL or NL season since 1901. There were 234 in 2000.
Who was the last 20-game winner in MLB? Spencer Strider of the Atlanta Braves, with 20 wins in 2023. Nobody reached 20 in 2024, 2025 or 2026; the 2026 leaders had 18.
What is an opener in baseball? A reliever who starts the game and pitches an inning or two before a longer-working pitcher takes over. The Tampa Bay Rays made it a regular tactic in 2018.
How this was built: starters' and relievers' innings, starts and complete games are the regular-season pitching splits of every AL and NL team in MLB's Stats API, by season from 1908, the first season in which they cover every start, to 2026; Federal League and Negro Leagues teams are left out. 200-inning pitchers, 20-game winners and pitchers used per game come from the API's season lines for every pitcher, with traded pitchers counted under their last team; these totals match the team splits to within 0.5 percent of innings in every season except 1914, which is left out of the pitchers-per-game figures. Pitch counts are quoted from 2000. The 2026 figures cover the complete regular season, March 25 to September 27, as recorded on October 13.