We added up the regular-season batting totals of every American and National League team in MLB's Stats API: strikeouts, walks, home runs, hits and plate appearances. Strikeouts per game means per team, the same measure as runs per game, and the strikeout rate is strikeouts divided by plate appearances. The API's strikeout totals are complete for every team from 1913, so the series starts there.
MLB strikeouts per game by decade
From 1913 to 1919, teams struck out 3.57 times a game, 9.6 percent of plate appearances. The 1920s had the fewest: 2.81 a game and 7.2 percent. The rate passed 10 percent in the 1950s and reached 15.1 percent in the 1960s, at 5.71 strikeouts a game.
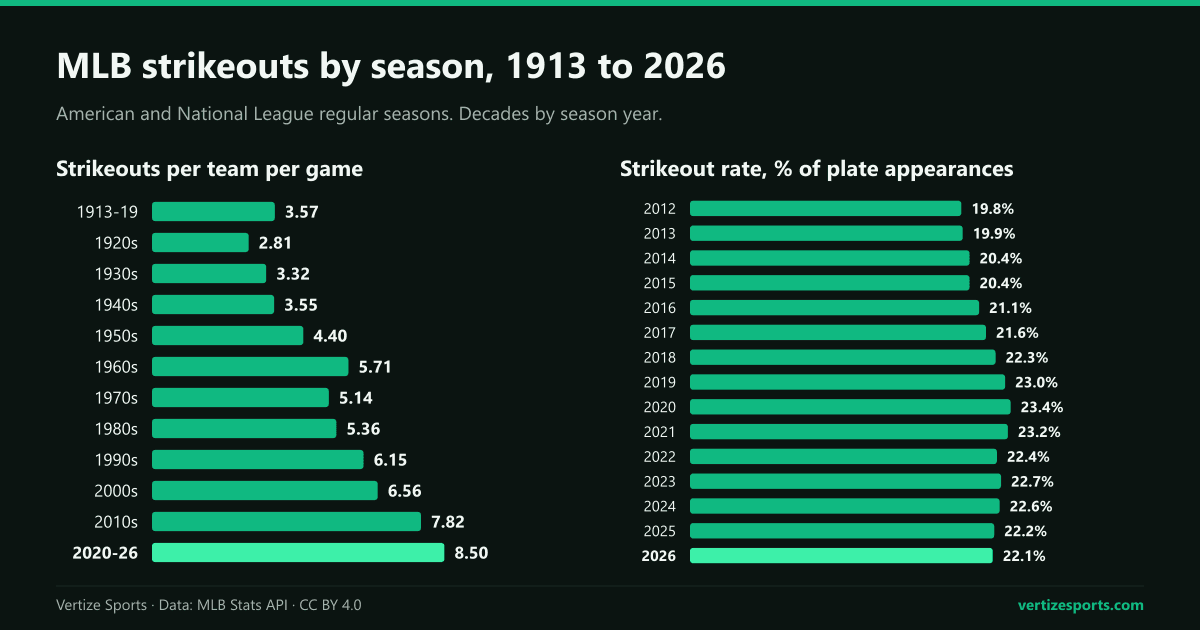
The 1960s figure owes much to the strike zone. In 1963 it grew to run from the top of the shoulders to the knees, and the strikeout rate went from 14.1 percent in 1962 to 15.3; it peaked at 15.9 in 1967, a mark that stood until 1995. For 1969 the smaller zone returned and the mound was lowered, and the rate fell to 15.2.
The 1970s dipped to 13.5 percent. Every decade since has been higher than the one before: 15.9 percent in the 1990s, 17.0 in the 2000s, 20.5 in the 2010s and 22.6 in the seven seasons of the 2020s.
| Seasons | Strikeouts per game | Strikeout rate | Three true outcomes |
|---|---|---|---|
| 1913-19 | 3.57 | 9.6% | 17.7% |
| 1920s | 2.81 | 7.2% | 16.0% |
| 1930s | 3.32 | 8.5% | 18.2% |
| 1940s | 3.55 | 9.2% | 19.8% |
| 1950s | 4.40 | 11.4% | 22.9% |
| 1960s | 5.71 | 15.1% | 25.5% |
| 1970s | 5.14 | 13.5% | 24.1% |
| 1980s | 5.36 | 14.1% | 24.6% |
| 1990s | 6.15 | 15.9% | 27.3% |
| 2000s | 6.56 | 17.0% | 28.4% |
| 2010s | 7.82 | 20.5% | 31.5% |
| 2020-26 | 8.50 | 22.6% | 34.2% |
MLB strikeout rate by year: the climb to 2020
Strikeouts per game rose in 14 straight seasons, from 6.30 per team per game in 2005 to 8.81 in 2019, still the most of any season. Per plate appearance the climb lasted one more year: the strikeout rate reached 23.4 percent in the 60-game 2020 season, the highest since at least 1913, then 23.2 percent in 2021, the highest of any 162-game season.
2018: the first season with more strikeouts than hits
In 2018 batters struck out 41,207 times and collected 41,018 hits, 189 more strikeouts than hits. CBS Sports reported it as the first time in baseball history, with 22.3 percent of plate appearances ending in a strikeout, then the highest rate ever, and quoted Joe Torre, MLB's chief baseball officer, saying the game did not have enough balls in play. The year before, hits had still led by 2,111; in 2000 they led by 13,890.
Strikeouts have outnumbered hits in all nine seasons since. The gap was widest in 2021, at 2,661, and in 2026 it was 851: 40,700 strikeouts against 39,849 hits.
The three true outcomes and fewer balls in play
A strikeout, a walk and a home run are known as the three true outcomes, the plate appearances whose result does not depend on the fielders. Together they made up 29.1 percent of plate appearances in 2000 and peaked at 36.1 percent in 2020. In 2026 the share was 34.1 percent, the fifth-highest since 1913, against 16.0 percent in the 1920s.
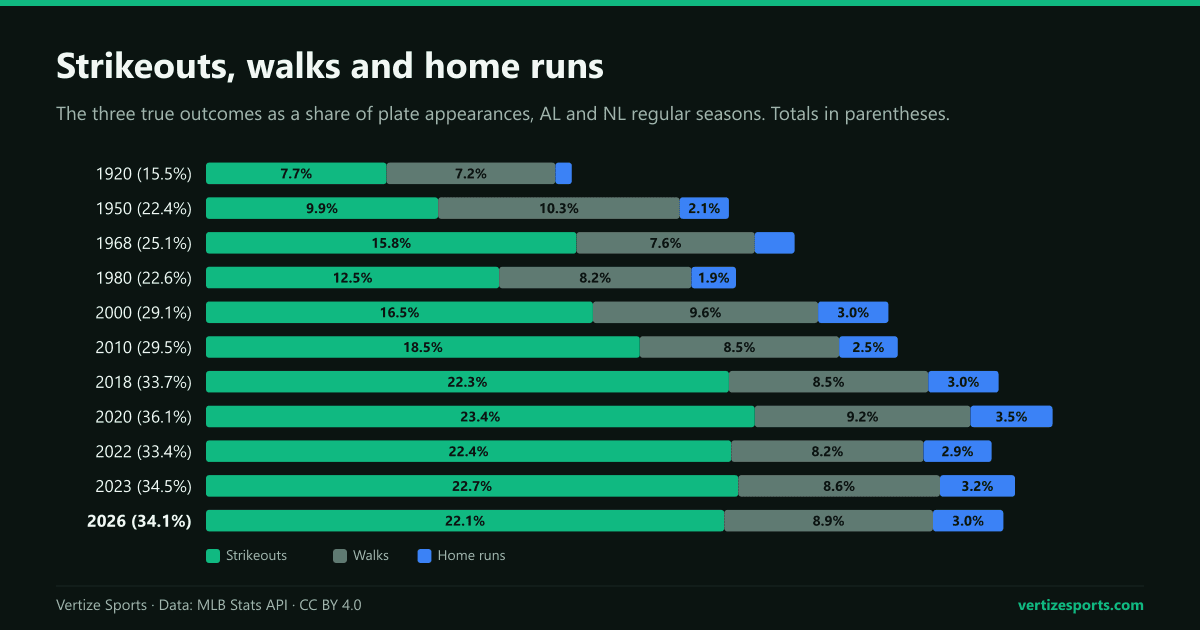
The other side of that trend is the ball in play. In 2000, 70.1 percent of plate appearances ended with the ball put in play other than a home run; in 2026, 64.7 percent. That is 27.46 balls in play per team per game then and 24.50 now, about three fewer, and hits per game fell from 9.31 to 8.20.
Did the 2023 rule changes cut strikeouts?
MLB brought in three rule changes in 2023, and Commissioner Rob Manfred said the league's research showed fans wanted more balls in play:
Two, fans want more action, more balls in play.
Rob Manfred, MLB commissioner, announcing the 2023 rule changes
- A pitch timer: 15 seconds between pitches with the bases empty and 20 with runners on.
- Shift limits: four players on the infield, two on each side of second base, which MLB said was meant to raise the batting average on balls in play.
- Bigger bases: 18 inches square instead of 15.
Strikeouts did not fall in 2023. The rate went from 22.4 percent to 22.7, and strikeouts per game from 8.40 to 8.61; walks and home runs rose too, so the share of plate appearances with a ball in play dropped from 65.4 percent to 64.3. What changed was what happened to those balls: the batting average on balls in play rose from .290 to .297, and hits from 8.16 to 8.40 a game.
Since then the strikeout rate has eased each year, to 22.6 percent in 2024, 22.2 in 2025 and 22.1 in 2026, while the batting average on balls in play went back to .290, its 2022 level.
MLB strikeouts in 2026: final regular-season figures
The 2026 regular season ended on Sunday, September 27, and every result is on the MLB schedule. Batters struck out 40,700 times in 2,429 games, 8.38 per team per game, a shade above the 8.36 of 2025. The rate fell to 22.1 percent because there were more plate appearances, 37.8 per team per game against 37.6, as walks rose.
The walk rate climbed from 8.4 percent to 8.9, the highest since 2020 (9.2) and the highest in a full season since 2000 (9.6). It was the first season of the ABS Challenge System, in which a pitcher, catcher or batter can have the automated system review an umpire's ball or strike call, with two challenges per team that are kept when they succeed. Home runs came on 3.0 percent of plate appearances, and teams scored 4.48 runs a game, as our study of MLB runs per game by season shows.
- Fewest strikeouts: the Tampa Bay Rays, 1,145, or 18.8 percent of plate appearances, on the way to a 98-64 record. The Toronto Blue Jays struck out 1,149 times.
- Most strikeouts: the Los Angeles Angels, 1,550, or 25.5 percent, in a 62-100 season, just ahead of the Cincinnati Reds with 1,544.
- Most strikeouts by a pitching staff: the Philadelphia Phillies, 1,577, then the Milwaukee Brewers with 1,544. The Colorado Rockies' staff had the fewest, 1,113.
- Fifteen of the 30 teams struck out more often than they got a hit.
Each club's final record is in the MLB season simulator, and the postseason is on the 2026 MLB playoff bracket. For how runs turn into wins, see our run differential analysis.
MLB strikeouts by season since 2000
| Season | Strikeouts per game | Strikeout rate | Walk rate | Home run rate | Three true outcomes | Strikeouts minus hits |
|---|---|---|---|---|---|---|
| 2026 | 8.38 | 22.1% | 8.9% | 3.0% | 34.1% | +851 |
| 2025 | 8.36 | 22.2% | 8.4% | 3.1% | 33.7% | +507 |
| 2024 | 8.48 | 22.6% | 8.2% | 3.0% | 33.8% | +1,374 |
| 2023 | 8.61 | 22.7% | 8.6% | 3.2% | 34.5% | +1,004 |
| 2022 | 8.40 | 22.4% | 8.2% | 2.9% | 33.4% | +1,138 |
| 2021 | 8.68 | 23.2% | 8.7% | 3.3% | 35.1% | +2,661 |
| 2020 | 8.68 | 23.4% | 9.2% | 3.5% | 36.1% | +1,147 |
| 2019 | 8.81 | 23.0% | 8.5% | 3.6% | 35.1% | +784 |
| 2018 | 8.48 | 22.3% | 8.5% | 3.0% | 33.7% | +189 |
| 2017 | 8.25 | 21.6% | 8.5% | 3.3% | 33.5% | -2,111 |
| 2016 | 8.03 | 21.1% | 8.2% | 3.0% | 32.3% | -3,294 |
| 2015 | 7.71 | 20.4% | 7.7% | 2.7% | 30.7% | -4,660 |
| 2014 | 7.70 | 20.4% | 7.6% | 2.3% | 30.3% | -4,154 |
| 2013 | 7.55 | 19.9% | 7.9% | 2.5% | 30.3% | -5,383 |
| 2012 | 7.50 | 19.8% | 8.0% | 2.7% | 30.4% | -5,637 |
| 2011 | 7.10 | 18.6% | 8.1% | 2.5% | 29.2% | -7,779 |
| 2010 | 7.06 | 18.5% | 8.5% | 2.5% | 29.5% | -8,248 |
| 2009 | 6.91 | 18.0% | 8.9% | 2.7% | 29.5% | -9,933 |
| 2008 | 6.77 | 17.5% | 8.7% | 2.6% | 28.8% | -11,088 |
| 2007 | 6.62 | 17.1% | 8.5% | 2.6% | 28.2% | -12,788 |
| 2006 | 6.52 | 16.8% | 8.4% | 2.9% | 28.1% | -13,418 |
| 2005 | 6.30 | 16.4% | 8.2% | 2.7% | 27.3% | -13,347 |
| 2004 | 6.55 | 16.9% | 8.6% | 2.9% | 28.4% | -12,694 |
| 2003 | 6.34 | 16.4% | 8.5% | 2.8% | 27.7% | -13,256 |
| 2002 | 6.47 | 16.8% | 8.7% | 2.7% | 28.2% | -11,878 |
| 2001 | 6.67 | 17.3% | 8.5% | 2.9% | 28.7% | -11,475 |
| 2000 | 6.45 | 16.5% | 9.6% | 3.0% | 29.1% | -13,890 |
MLB strikeouts: frequently asked questions
How many strikeouts per game are there in MLB? In the 2026 regular season, 8.38 per team per game, or about 16.8 for both teams together, and 22.1 percent of plate appearances ended in a strikeout.
When did strikeouts first outnumber hits in MLB? In 2018, with 41,207 strikeouts and 41,018 hits in our count. It has happened in every season since, nine in a row through 2026.
What was the highest strikeout rate in MLB history? 23.4 percent of plate appearances in the shortened 2020 season. Among full seasons the highest is 2021, at 23.2 percent, and the most strikeouts per game came in 2019, 8.81 per team.
What are the three true outcomes in baseball? Strikeouts, walks and home runs, the results that do not involve the fielders. They made up 34.1 percent of MLB plate appearances in 2026, up from 29.1 percent in 2000.
How this was built: strikeouts, walks (intentional ones included), home runs, hits, hit batters and plate appearances are the regular-season batting totals of every AL and NL team in MLB's Stats API for every season from 1913, the first with complete strikeout totals, to 2026; Federal League and Negro Leagues teams are left out. Per-game figures divide by team games; rates divide by plate appearances. Balls in play are plate appearances minus strikeouts, walks, hit batters, home runs and catcher's interference. Batting average on balls in play is hits minus home runs, divided by at-bats minus strikeouts and home runs plus sacrifice flies. Batting strikeouts match the pitching staffs' total in 2026. The 2026 figures cover the complete regular season, March 25 to September 27, as recorded on October 13; our 2018 hit total is two below the one CBS Sports reported.