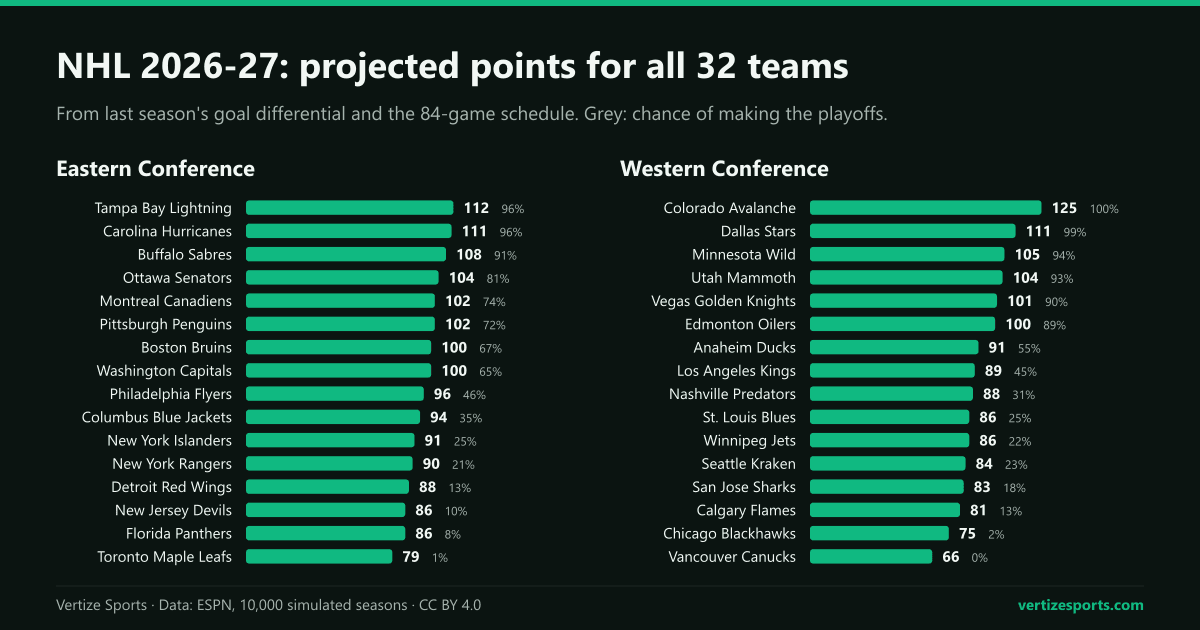
The season opens on Tuesday, September 29, matching the earliest start in league history, and it opens with a banner. Carolina, who beat Vegas in six games in June for their second Stanley Cup, raise it before facing Florida at 5 p.m. ET, the first of five games that night: Canadiens at Maple Leafs, Rangers at Bruins, Canucks at Oilers and Blackhawks at Golden Knights. Every team plays 84 games, only the third time in the league's history after 1992-93 and 1993-94, with the two extra games a home-and-away pair against a division rival. The change was written into the collective bargaining agreement ratified in July 2025, and the regular season ends on Saturday, April 10.
Before a puck drops, we ran the full 1,344-game schedule through the model behind the Vertize NHL simulator, 10,000 times. It produces two numbers for every team, a projected points total and a chance of making the playoffs, and both are worth reading for what they say and for what they cannot possibly know.
How the predictor rates a team
Each team gets one number: its goal differential per game last season. Colorado outscored opponents by 1.21 goals a night, +99 over the season and the best mark in the league by a distance. Vancouver were outscored by 1.22 a night, 100 goals in all, the worst.
Points are left out on purpose. Hockey standings carry a lot of noise: close to a quarter of games go past regulation, and the point for losing in overtime rewards teams for reaching extra time rather than for winning. How much a team outscores its opponents by is a steadier guide to how good it is from one season to the next.
Every game is then simulated the same way. The home team starts with a small edge, enough to win 52.4 percent of the time between two equal sides. Just under a quarter of games, 24.8 percent, go to overtime, where the loser still collects a point, as in the real league. When Colorado host Vancouver, the best team by this measure against the worst, the home side wins 87 percent of the time.
The projections below are averages over all those seasons, so a single run of the simulator will land a few points above or below. Last season's totals came from 82 games, which means every team starts about two points up on its old total from the two extra games alone.
Projected points: Eastern Conference
| Team | Projected points | Playoff odds | 2025-26 points |
|---|---|---|---|
| Tampa Bay Lightning | 112 | 96% | 106 |
| Carolina Hurricanes | 111 | 96% | 113 |
| Buffalo Sabres | 108 | 91% | 109 |
| Ottawa Senators | 104 | 81% | 99 |
| Montreal Canadiens | 102 | 74% | 106 |
| Pittsburgh Penguins | 102 | 72% | 98 |
| Boston Bruins | 100 | 67% | 100 |
| Washington Capitals | 100 | 65% | 95 |
| Philadelphia Flyers | 96 | 46% | 98 |
| Columbus Blue Jackets | 94 | 35% | 92 |
| New York Islanders | 91 | 25% | 91 |
| New York Rangers | 90 | 21% | 77 |
| Detroit Red Wings | 88 | 13% | 92 |
| New Jersey Devils | 86 | 10% | 87 |
| Florida Panthers | 86 | 8% | 84 |
| Toronto Maple Leafs | 79 | 1% | 78 |
Projected points: Western Conference
| Team | Projected points | Playoff odds | 2025-26 points |
|---|---|---|---|
| Colorado Avalanche | 125 | 100% | 121 |
| Dallas Stars | 111 | 99% | 112 |
| Minnesota Wild | 105 | 94% | 104 |
| Utah Mammoth | 104 | 93% | 92 |
| Vegas Golden Knights | 101 | 90% | 95 |
| Edmonton Oilers | 100 | 89% | 93 |
| Anaheim Ducks | 91 | 55% | 92 |
| Los Angeles Kings | 89 | 45% | 90 |
| Nashville Predators | 88 | 31% | 86 |
| St. Louis Blues | 86 | 25% | 86 |
| Winnipeg Jets | 86 | 22% | 82 |
| Seattle Kraken | 84 | 23% | 79 |
| San Jose Sharks | 83 | 18% | 86 |
| Calgary Flames | 81 | 13% | 77 |
| Chicago Blackhawks | 75 | 2% | 72 |
| Vancouver Canucks | 66 | under 1% | 58 |
How many points make the playoffs in an 84-game season
The format has not changed: the top three in each division plus two wild cards per conference. In the simulations the last wild card in the East finishes on a median of 99 points, and in 80 percent of seasons somewhere between 95 and 103. In the West the line sits lower, at 94, with the same 80 percent range running from 89 to 99.
The gap comes from the shape of each conference. The East has eight teams projected at 100 points or more and a crowded middle behind them; the West has six and then a steep drop, so eighth place costs less. For comparison, over the last nine full 82-game seasons the last team in needed a median of 95 points, as we counted in how many wins it takes to make the playoffs.
Where the model disagrees with last season's standings
The biggest gaps between last season's points and this season's projection belong to teams whose record and goal differential told different stories. The Rangers finished last in the East on 77 points but were outscored by only 12 goals, the profile of a team that lost its close games, and the model has them on 90. Utah were +28 but needed a wild card to reach the playoffs on 92 points; the model makes them a 104-point team, fourth in the Central.
Montreal are the mirror image: 106 points from a goal differential of +27, which normally buys fewer, and a projection of 102. Vancouver stay last whatever the method, but even they climb from 58 to 66, because a season as bad as theirs rarely repeats in full.
What the model cannot see
The ratings were set when last season ended, and nothing since is in them: not the playoffs, not the draft and not a summer of trades and signings. These are the moves that most change the numbers above.
- Florida Panthers (projected 86): the model is rating a team that played all of last season without Aleksander Barkov, who is back from a torn ACL. Florida also traded for Brady Tkachuk, while Sergei Bobrovsky left for Toronto and Jacob Markstrom arrived from New Jersey to replace him.
- Ottawa Senators (projected 104): lost their captain Tkachuk for a package of picks, then used one of them to get William Eklund from San Jose.
- Washington Capitals (projected 100): added Alex Tuch on an eight-year, $84 million sign-and-trade and traded for Jordan Kyrou. Buffalo (projected 108) lost Tuch and also sent Bowen Byram to Chicago.
- Toronto Maple Leafs (projected 79): the lowest number in the East and the busiest summer. They signed Gavin McKenna, the first pick in the draft, added Bobrovsky and Darren Raddysh, and hired Jim Hiller as coach.
- New York Rangers (projected 90): signed Pavel Dorofeyev after a 37-goal season in Vegas and traded Vincent Trocheck to Utah.
- Utah Mammoth (projected 104): added Trocheck but sent JJ Peterka to Boston, where the Bruins are projected at 100.
- Edmonton Oilers (projected 100): hired Mike Babcock and traded Darnell Nurse to San Jose. New goalie Frederik Andersen was expected to miss training camp with the knee he hurt in the Final.
- Winnipeg Jets (projected 86): Connor Hellebuyck did not report to camp and was suspended after asking for a trade.
- Chicago Blackhawks (projected 75): Connor Bedard is recovering from shoulder surgery that was expected to keep him out for about four months from early July.
- Carolina Hurricanes (projected 111): the champions start without Seth Jarvis, out after shoulder surgery until late October at the earliest.
Overrule it: how to use the NHL simulator
This is where the simulator is more useful than any projection. It starts from the same ratings, but every game is yours to change. Type a score into any game and both conference tables reorder as you go, with the top eight in each marked.
- Press Simulate season to fill every game with the model and watch a whole season play out. Run it again and it comes out differently.
- Use Simulate night to go one night at a time, moving through the calendar month by month.
- Give a team the games you think its new arrivals will swing, and see where it finishes.
- Once the season starts, finished games lock in with their real scores. From then on you are not predicting the season, you are finishing it.
- Clear wipes your scores so you can start again.
- The full schedule has every night of the season, starting with opening night in September.
Dates to circle
- September 29: opening night, five games starting with Panthers at Hurricanes at 5 p.m. ET.
- October 25: the Heritage Classic, Canadiens at Jets, outdoors in Winnipeg.
- November 12 and 14: the Global Series in Helsinki, Hurricanes and Kraken.
- December 18 and 20: the Global Series in Düsseldorf, Blackhawks and Senators.
- December 31: the Winter Classic, Avalanche at Mammoth at Rice-Eccles Stadium in Salt Lake City.
- February 5 and 6, 2027: All-Star weekend at UBS Arena, with a new five-team, three-on-three format.
- February 20, 2027: the Stadium Series, Golden Knights at Stars at AT&T Stadium.
- April 10, 2027: the last day of the regular season, with all 32 teams in action.
NHL 2026-27 predictions: frequently asked questions
When does the 2026-27 NHL season start? On Tuesday, September 29, 2026, with five games. The first is Florida at Carolina at 5 p.m. ET, with the Hurricanes raising their Stanley Cup banner.
How many games are in the 2026-27 NHL season? 84 per team and 1,344 in all, two more per team than in any season since 1993-94.
Who is projected to win the Presidents' Trophy? Colorado, in 68 percent of our simulated seasons. Tampa Bay (8 percent), Carolina (7) and Dallas (6) are the only other teams above five.
How many points will it take to make the playoffs? About 99 in the East and 94 in the West, going by the median last wild card across 10,000 simulations.
How this was built: ratings are each team's 2025-26 goal differential per game from ESPN's final standings, scaled so the average team is zero. Each of the 1,344 games on the 2026-27 schedule was simulated 10,000 times with the NHL simulator's model: 24.8 percent of games go to overtime, the home side wins 52.4 percent of games between equal teams, a win is worth two points and an overtime loss one. Playoff odds use the real format, three per division plus two wild cards per conference, with ties broken by wins and then at random. Trades, signings, injuries and rookies are not included.