We added up the power-play opportunities, power-play goals and short-handed goals of every NHL team in every regular season since 2005-06, the first after the lockout, from the league's own team statistics published on NHL.com. Power-play percentage is goals divided by opportunities. Penalty-kill percentage is the share of times short-handed that a team did not allow a power-play goal, so across the whole league it is 100 minus the power-play rate: 78.9 percent in 2025-26.
One rule keeps the numbers small. Under Rule 16.2 of the NHL's 2025-26 rulebook, when a team short-handed by a minor penalty gives up a goal, the first of its minor penalties ends at once, except on a penalty shot. A two-minute minor can cost a team at most one goal. The league added that rule for 1956-57, according to its history of rule changes; before it, a penalized player sat out the full two minutes.
NHL power play percentage by season since 2005-06
The league-wide rate stayed between 17.3 and 18.9 percent through 2015-16, with the low in 2011-12. It reached 20.2 percent in 2017-18 and has been at 20 percent or more in every season since 2021-22, peaking at 21.6 percent in 2024-25. Since 1977-78, the first season for which the NHL lists every team's power plays, only eight seasons were higher, all from 1978-79 to 1985-86.
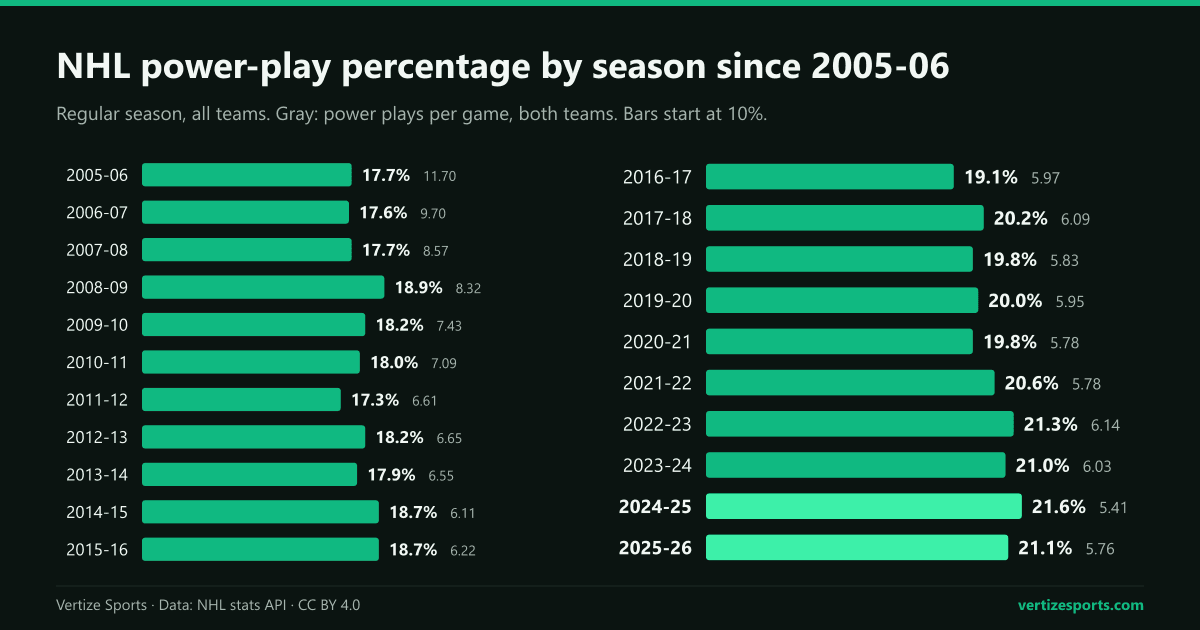
The number of chances moved the other way. After the 2005 lockout the NHL brought in a package of rule changes, from two-line passes to the shootout, and called obstruction more strictly, and in 2005-06 teams had 11.70 power plays a game. That fell to 8.57 by 2007-08 and to 5.41 in 2024-25, the fewest since 1977-78, as our count of NHL goals per game by season shows.
How many goals per game come on the power play
Fewer chances meant fewer power-play goals, even with better conversion. NHL games produced 2.07 power-play goals in 2005-06, both teams combined, and 1.22 in 2025-26: 1,595 in the season, against 2,545 in 2005-06 in fewer games. The low was 1.14 a game, in 2011-12, 2014-15, 2016-17 and 2020-21. Short-handed goals fell too, from 318 to 205.
The power play is still worth real points. At 2025-26 volume, a team got about 236 power plays in its 82 games. Each percentage point of conversion is about 2.4 goals over a season, and across these 21 seasons each extra goal of goal differential has been worth 0.34 standings points, so one point of power-play percentage buys about 0.8 points in the standings. The gap between the best power play of 2025-26, the Edmonton Oilers' 30.6 percent, and the worst, the Philadelphia Flyers' 15.7, comes to about 35 goals, or 12 points.
| Season | PP per game | PP% | PP goals per game | Short-handed goals | Best power play |
|---|---|---|---|---|---|
| 2025-26 | 5.76 | 21.1% | 1.22 | 205 | Edmonton Oilers, 30.6% |
| 2024-25 | 5.41 | 21.6% | 1.17 | 208 | Winnipeg Jets, 28.9% |
| 2023-24 | 6.03 | 21.0% | 1.27 | 234 | Tampa Bay Lightning, 28.6% |
| 2022-23 | 6.14 | 21.3% | 1.31 | 250 | Edmonton Oilers, 32.4% |
| 2021-22 | 5.78 | 20.6% | 1.19 | 211 | Toronto Maple Leafs, 27.3% |
| 2020-21 | 5.78 | 19.8% | 1.14 | 127 | Edmonton Oilers, 27.6% |
| 2019-20 | 5.95 | 20.0% | 1.19 | 195 | Edmonton Oilers, 29.5% |
| 2018-19 | 5.83 | 19.8% | 1.15 | 233 | Tampa Bay Lightning, 28.2% |
| 2017-18 | 6.09 | 20.2% | 1.23 | 211 | Pittsburgh Penguins, 26.2% |
| 2016-17 | 5.97 | 19.1% | 1.14 | 184 | Buffalo Sabres, 24.5% |
| 2015-16 | 6.22 | 18.7% | 1.16 | 190 | Anaheim Ducks, 23.1% |
| 2014-15 | 6.11 | 18.7% | 1.14 | 168 | Washington Capitals, 25.3% |
| 2013-14 | 6.55 | 17.9% | 1.17 | 202 | Pittsburgh Penguins, 23.4% |
| 2012-13 | 6.65 | 18.2% | 1.21 | 93 | Washington Capitals, 26.8% |
| 2011-12 | 6.61 | 17.3% | 1.14 | 185 | Nashville Predators, 21.6% |
| 2010-11 | 7.09 | 18.0% | 1.28 | 206 | Vancouver Canucks, 24.3% |
| 2009-10 | 7.43 | 18.2% | 1.35 | 191 | Washington Capitals, 25.2% |
| 2008-09 | 8.32 | 18.9% | 1.58 | 235 | Detroit Red Wings, 25.5% |
| 2007-08 | 8.57 | 17.7% | 1.52 | 239 | Montreal Canadiens, 24.1% |
| 2006-07 | 9.70 | 17.6% | 1.71 | 268 | Montreal Canadiens, 22.8% |
| 2005-06 | 11.70 | 17.7% | 2.07 | 318 | Detroit Red Wings, 22.1% |
The best power play in NHL history, and the worst
The NHL's records list every team's power-play chances from 1977-78. Since then, these team seasons stand out at the top and bottom:
- Best: the 2022-23 Edmonton Oilers, 89 goals on 275 power plays, 32.4 percent, ahead of the 1977-78 Montreal Canadiens at 31.9.
- The Oilers also have the second- and third-best seasons since 2005-06, 30.6 percent in 2025-26 and 29.5 in 2019-20. Next is the 2024-25 Winnipeg Jets, at 28.9.
- Worst: the 2020-21 Anaheim Ducks, 11 goals on 123 power plays in a 56-game season, 8.9 percent.
- Worst over a full 82 games since 2005-06: the 2013-14 Florida Panthers, 10.0 percent.
Edmonton, whose team page tracks the current season, is also the clearest case of a great power play that did not decide everything: the 2022-23 record team lost in the second round.
Best penalty kill in NHL history and the worst
The best penalty kill since 1977-78 belongs to the 2011-12 New Jersey Devils, who allowed 27 power-play goals in 259 times short-handed, 89.6 percent, and scored 15 short-handed goals of their own. That spring they reached the Stanley Cup Final and lost to the Los Angeles Kings.
The worst since 1982-83 is the 2024-25 Detroit Red Wings, at 70.1 percent, 55 goals allowed in 184 times short-handed, even though their own power play scored 27.0 percent of the time. Only three earlier teams went lower, all from 1978-79 to 1982-83. In 2025-26 the Colorado Avalanche led the league at 84.6 percent and the Vancouver Canucks were last at 71.5.
Adding the two rates gives a simple special-teams index, where 100 is average:
| Season | Team | PP% | PK% | Index | Points % |
|---|---|---|---|---|---|
| 2019-20 | Edmonton Oilers | 29.5% | 84.4% | 113.9 | 58.5% |
| 2023-24 | Carolina Hurricanes | 26.9% | 86.4% | 113.3 | 67.7% |
| 2018-19 | Tampa Bay Lightning | 28.2% | 85.0% | 113.3 | 78.0% |
| 2023-24 | Tampa Bay Lightning | 28.6% | 83.3% | 112.0 | 59.8% |
| 2021-22 | St. Louis Blues | 27.0% | 84.1% | 111.1 | 66.5% |
| 2024-25 | New York Islanders | 12.6% | 72.2% | 84.8 | 50.0% |
| 2020-21 | New Jersey Devils | 14.2% | 70.9% | 85.1 | 40.2% |
| 2024-25 | Anaheim Ducks | 11.8% | 74.2% | 86.0 | 48.8% |
| 2013-14 | Florida Panthers | 10.0% | 76.0% | 86.0 | 40.2% |
| 2022-23 | Anaheim Ducks | 15.7% | 72.1% | 87.9 | 35.4% |
How much do special teams decide NHL games
Less than even-strength play, by a wide margin. We compared each team's points percentage with its special-teams numbers across the 644 team seasons from 2005-06 to 2025-26, after taking out each season's league average. A correlation of 1 would mean a perfect match:
- Power-play percentage: 0.50, so it accounts for about 25 percent of the differences in points percentage.
- Penalty-kill percentage: 0.46, about 21 percent.
- The two added together: 0.63, about 39 percent.
- Special-teams goal differential per game, power-play and short-handed goals for minus against: 0.67.
- Even-strength goal differential per game: 0.91, about 84 percent. At five-on-five alone, recorded since 2009-10, it is 0.89.
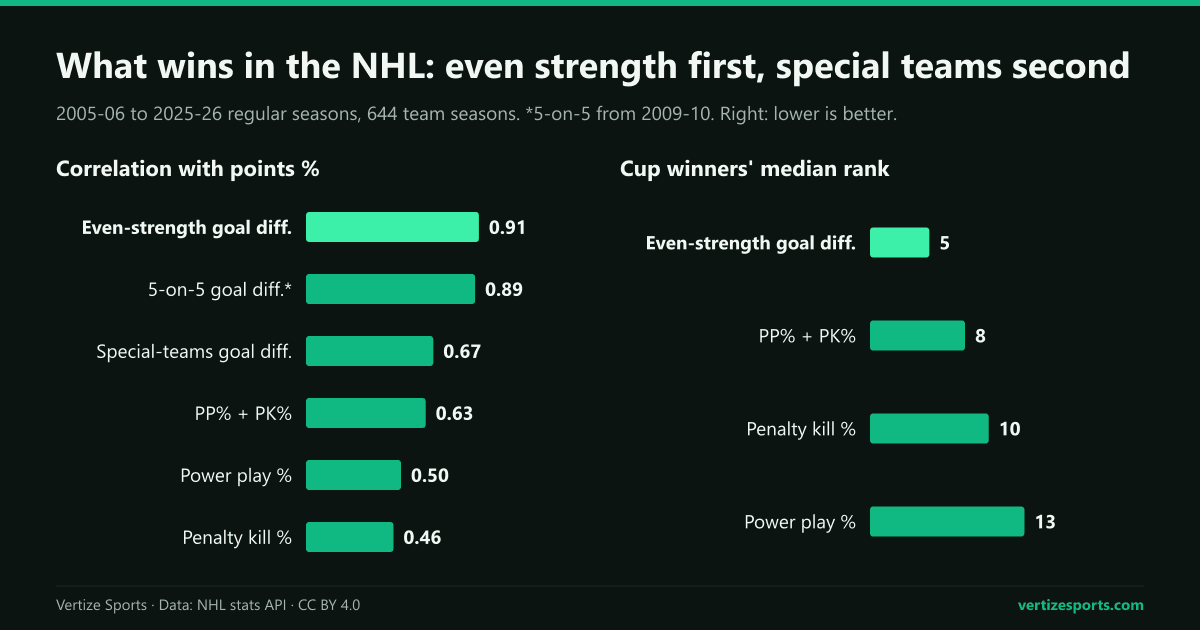
The reason is volume. Teams spend most of every game at even strength, and the spread between teams there is about 0.41 goals a game, more than twice the 0.19 on special teams. Taken together, even-strength and special-teams goal differential account for 91 percent of the differences in points percentage, more than three parts even strength to one part special teams.
Does the best power play win the Stanley Cup
Not once since 2005-06. The team with the best regular-season power play made the playoffs in 19 of 21 seasons; the 2006-07 Montreal Canadiens and the 2016-17 Buffalo Sabres missed. Two reached the Stanley Cup Final and lost: the 2008-09 Detroit Red Wings, to the Pittsburgh Penguins, and the 2010-11 Vancouver Canucks, to the Boston Bruins. The best penalty kill has not won either, and only one team led the league in the special-teams index and won the Cup, the 2006-07 Anaheim Ducks, third on the power play and fifth on the penalty kill.
The champions' ranks tell the same story. The median Cup winner since 2006 ranked 13th in power-play percentage and 10th in penalty kill, but 5th in even-strength goal differential per game; 13 of the 21 were in the top five there, against five in the top five on the power play. The 2013-14 Los Angeles Kings won with the 27th power play, and the 2010-11 Bruins ranked 20th on the power play and first at even strength. The 2025-26 Carolina Hurricanes were fourth on the power play, 11th on the penalty kill and fifth in the index.
The best regular-season record has not been a sure path either: the Presidents' Trophy winner has won the Cup twice in 21 seasons since 2005-06.
The NHL power play in 2026-27 so far
The 2026-27 season opened on September 29. Through October 12, the 89 finished games had 592 power plays, 6.65 a game, and 121 power-play goals, 20.4 percent, too few games to say anything about the season. The NHL standings update after every night, and the NHL simulator plays out the rest of the season from them, with finished games locked.
NHL power play and penalty kill: frequently asked questions
What is a good power-play percentage in the NHL? The league average was 21.1 percent in 2025-26, and three teams converted 25 percent or more. The lowest rate was 15.7 percent.
What is the best power-play percentage in NHL history? 32.4 percent, by the 2022-23 Edmonton Oilers, the highest since 1977-78, the first season for which the NHL lists every team's power plays.
Does a power-play goal end the penalty? For a minor penalty, yes: the first minor of the short-handed team ends as soon as the other team scores, under Rule 16.2, unless the goal comes on a penalty shot.
What is the best penalty kill in NHL history? 89.6 percent, by the 2011-12 New Jersey Devils, the best since 1977-78. The league average in 2025-26 was 78.9 percent.
How this was built: power-play opportunities and goals, times short-handed, power-play goals allowed and short-handed goals for every team in every NHL regular season from 2005-06 to 2025-26, and the finished 2026-27 games through October 12, 2026, from the NHL's stats API, the data behind NHL Stats, summed across teams; team records back to 1977-78 come from the same source. Even-strength goals against are all goals against minus power-play and short-handed goals against. Correlations use each team's figures minus its season's league average; standings points per goal come from a regression of points per game on goal differential per game. Stanley Cup winners and finalists are taken from the league's playoff game results.