A hockey table is the only one in major sport where the number of points available depends on how the game finishes. Sixty minutes and done, two points are shared out. Tied after sixty, three are: two for whoever wins in overtime or the shootout, and one for the team that lost it. That single extra point is the reason NHL standings are so hard to read at a glance.
How much is actually at stake
| System | Win in regulation | Win in overtime | Lose in overtime | Lose in regulation |
|---|---|---|---|---|
| NHL today | 2 | 2 | 1 | 0 |
| Two points a win | 2 | 2 | 0 | 0 |
| The 3-2-1, as in European soccer | 3 | 2 | 1 | 0 |
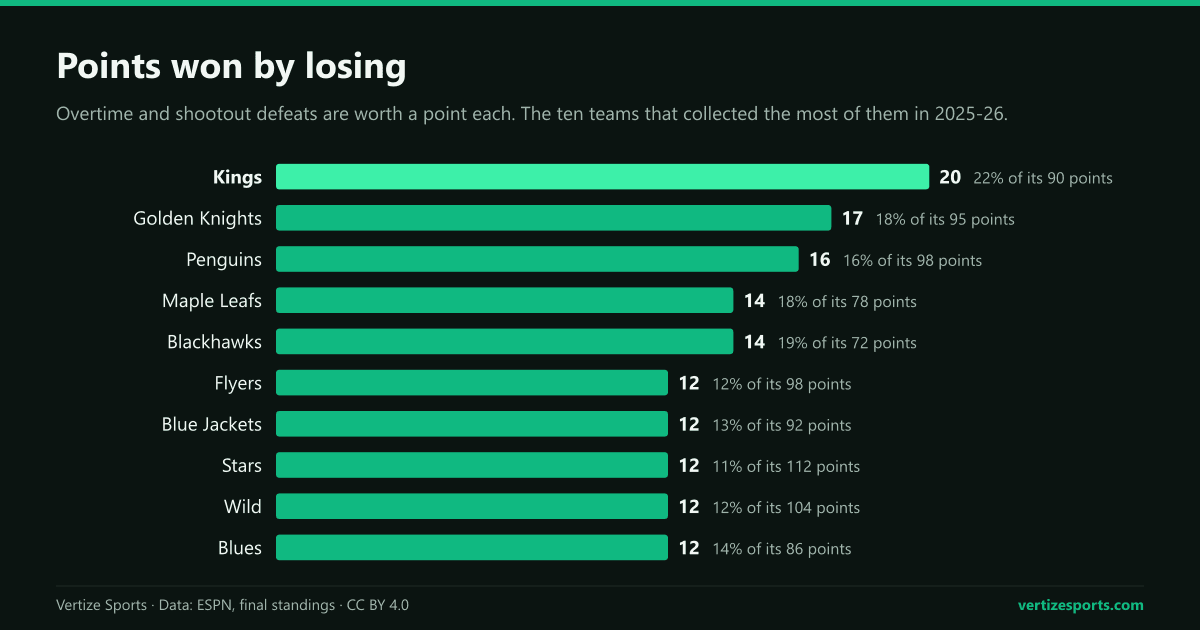
Across the 2025-26 season 24.8 percent of games went past regulation, and the league handed out 326 points for defeat. That is 11.1 percent of every point won in the entire league, awarded to teams that lost.
It is not spread evenly, which is the interesting part. The Los Angeles Kings finished on 90 points, 20 of them, 22 percent, collected in defeat. They won 35 games all season.
The same season, counted three ways
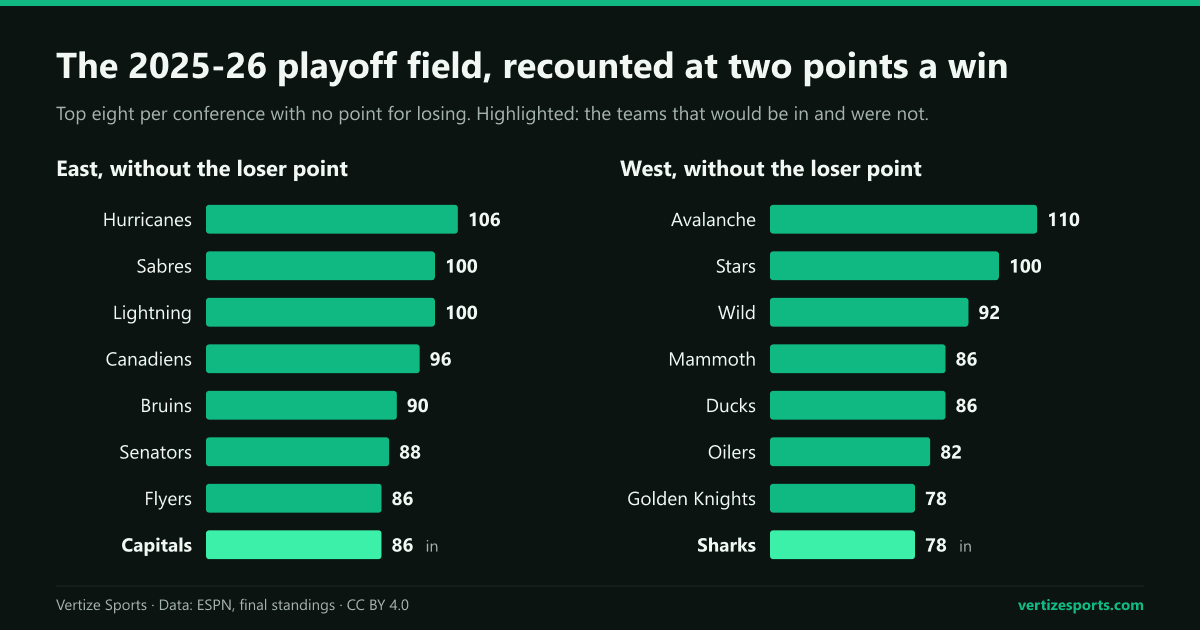
So we recounted it. Same games, same results, three different ways of paying for them: the NHL's own system, a flat two points for a win and nothing else, and the 3-2-1 that European soccer uses, where a regulation win is worth more than one snatched in overtime.
| Conference | System | In | Out |
|---|---|---|---|
| East | Two points a win | Capitals | Penguins |
| West | Two points a win | Sharks | Kings |
| East | The 3-2-1 | Capitals | Flyers |
| West | The 3-2-1 | Blues | Kings |
Two points a win costs the Kings their place in the West and hands it to the Sharks. The Kings won 35 games; the Sharks won 39. But the Kings banked 20 loser points to their rivals' 8. Under the current system that reads 90 to 86 and the Kings are in; strip the consolation and it reads 70 to 78 and they are not.
In the East the same team benefits both times, the Capitals, and a different one pays for it each time: the Penguins under a flat two points, the Flyers under the 3-2-1. Three systems, three different eighth places, one set of results.
Why the point exists at all
It exists because hockey used to allow ties. A game that ended level gave both teams a point, and when the league decided every night had to produce a winner it kept that point for the side still level after sixty minutes. Guaranteeing something to a team that reaches overtime is what stops the last ten minutes of a tied game from turning into a track meet neither side can afford to run.
The cost is a table that flatters anyone good at reaching overtime and losing there, and a points column that cannot be compared with any other sport's. A hockey team on 95 points has not won 47 games; it may have won 39 and lost 17 of them slowly.
What it means when you read the standings
- Points percentage, not points, is the honest measure: a team with games in hand is not behind by what the table says.
- Look at the regulation wins column. The NHL uses it as its first tiebreaker for exactly this reason, and it is the closest thing the table has to a record.
- A team five points back is not two and a half wins back. If the gap includes loser points it can vanish in a week; if it does not, it rarely does.
- Across the league, 11.1 percent of all points come from defeats. That is the size of the distortion you are reading around.
Count it yourself
The NHL simulator uses the league's real system, loser point included, because the object is the table as it will actually look. Games already played are locked with their real scores; the rest are yours.
- Fill in the run-in and watch the conference reorder, with the playoff line marked where it falls.
- The full schedule has every night of the season, month by month.
- For what the line costs in the first place, we counted the last team into the playoffs in four leagues: in the NHL a median of 95 points, the steepest bar of the four.
- For the season ahead, our 2026-27 projections run the whole 84-game schedule through the same model, loser point included.
Counted from the final 2025-26 standings: 32 teams, 82 games each. The recounts keep every result exactly as it happened and change only what each result is worth, so a game that went to overtime still went to overtime; it just pays differently.