We took every regular-season game since 2005-06, the first season with shootouts, from the NHL's game results, 22,632 games in the 18 full 82-game seasons, and counted the days each team had off before each game; zero days means the second night of a back-to-back. Three shortened seasons count only toward the schedule history: 2012-13, 48 games after a lockout; 2019-20, paused in March 2020; and 2020-21, 56 games.
Points percentage is the share of the two points on offer that a team took, with one point for an overtime or shootout loss. Because of that loser point, the average across all these games is 55.8 percent, not 50.
NHL back-to-back record by days of rest
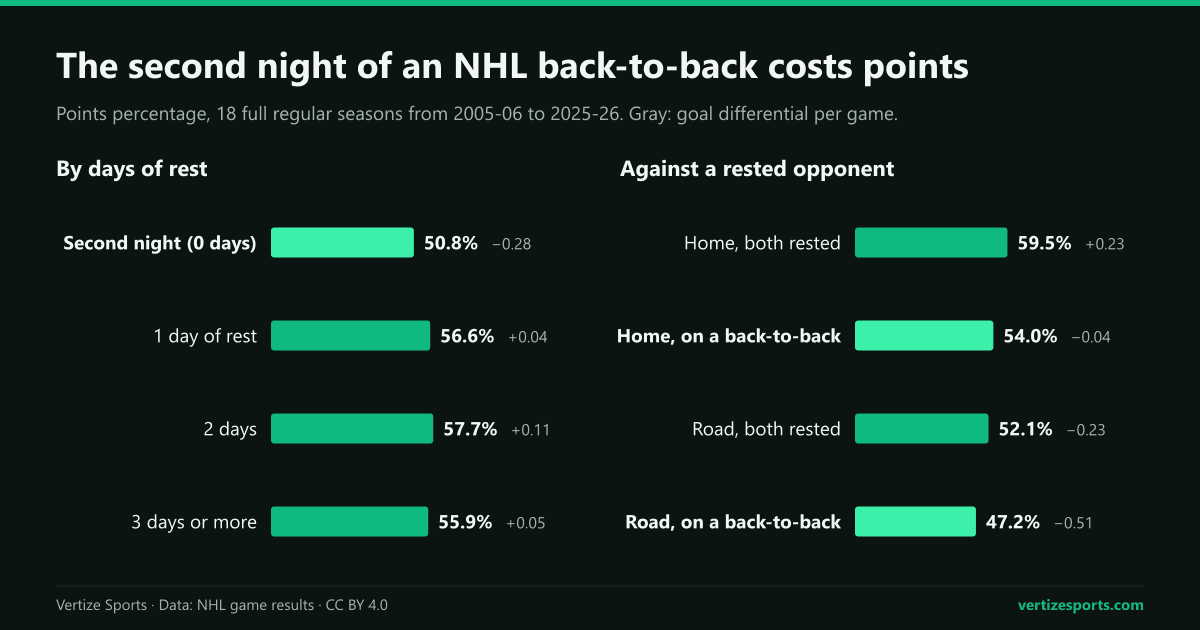
One day off is the usual NHL rhythm: 55.0 percent of team-games came after one day of rest and 17.3 percent on the second night of a back-to-back, when teams won 44.8 percent of their games, overtime and shootout wins included, against 50.9 percent with one day off.
| Days of rest | Share of games | Points % | Win % | Goals for | Goals against |
|---|---|---|---|---|---|
| 0 (back-to-back) | 17.3% | 50.8% | 44.8% | 2.72 | 3.01 |
| 1 | 55.0% | 56.6% | 50.9% | 2.90 | 2.86 |
| 2 | 19.2% | 57.7% | 52.1% | 2.92 | 2.81 |
| 3 or more | 8.5% | 55.9% | 50.2% | 2.91 | 2.86 |
The cost shows up at both ends of the ice: on the second night teams scored 0.18 goals a game fewer and allowed 0.15 more than with one day off. A second day of rest added only 1.1 points of points percentage, and three days or more, which include the returns from the holiday and All-Star breaks, added nothing.
Part of the raw gap is venue, not fatigue: 31.1 percent of second nights were home games, against 53.4 percent of games after one day off, and road teams take fewer points whatever their rest.
Second night of a back-to-back against a rested opponent
| Situation | Games | Home team points % | Home team win % | Avg. home goal differential |
|---|---|---|---|---|
| Both teams rested | 15,724 | 59.5% | 53.8% | +0.23 |
| Home team on a back-to-back, visitor rested | 1,291 | 54.0% | 48.3% | −0.04 |
| Visitor on a back-to-back, home team rested | 4,177 | 64.2% | 59.1% | +0.51 |
| Both teams on a back-to-back | 1,109 | 60.0% | 53.8% | +0.30 |
At home, a team on the second night of a back-to-back took 54.0 percent of the points against a rested visitor, down from the 59.5 percent home teams took when both sides had rested, and its average goal differential fell from +0.23 to −0.04. On the road the drop was from 52.1 to 47.2 percent, and from −0.23 to −0.51 goals a game.
That is 5.5 points of points percentage at home and 4.9 on the road, and 0.26 and 0.28 goals a game. In goals, the second night more than cancels home-ice advantage, small in hockey: in these 18 seasons the home team's average edge of 0.23 goals when both sides had rested (0.13 in 2025-26, our comparison of home advantage in six leagues found) turns into a deficit of 0.04. When both teams were on a back-to-back, the home team took 60.0 percent, about the same as when both had rested: what costs points is being more tired than the opponent.
The size of the effect matches basketball closely. NHL teams won 44.8 percent of their games on the second night and 50.9 percent after one day off; in the NBA the figures are 44.2 and 51.1 percent. Football has no back-to-backs at all, and our study of NFL rest days found that even the short week before Thursday games leaves no clear mark on results.
Road-road back-to-backs and other home and road combinations
The most common back-to-back is two road games on consecutive nights: 3,334 of the 7,733 second nights, 43.1 percent, against only 8.4 percent for two home games. Against rested opponents, though, the first night's venue barely mattered:
| First night, second night | All back-to-backs | Against a rested opponent | Points % | Win % |
|---|---|---|---|---|
| Home, then home | 650 | 341 | 54.5% | 48.7% |
| Road, then home | 1,757 | 950 | 53.8% | 48.2% |
| Home, then road | 1,992 | 1,373 | 47.6% | 41.2% |
| Road, then road | 3,334 | 2,804 | 47.1% | 40.8% |
At home on the second night, teams took 54.5 percent of the points after a home game and 53.8 percent after a road game; on the road, 47.6 and 47.1 percent. The extra travel of a road-road set or a trip home after a road game cost far less than playing the second game away from home.
Our game results do not identify starting goaltenders, so this study cannot measure how much of the drop comes from a team starting its backup on the second night rather than from fatigue. The figures above include every second night, whoever was in goal.
How many back-to-backs NHL teams play per season
Fewer than they used to:
- 2005-06 to 2010-11: 14.7 to 15.9 per team each season. The most by one team is 22, by the Buffalo Sabres in 2010-11 and the New Jersey Devils in 2013-14.
- 2023-24: 11.2 per team, the fewest of the 18 full seasons, with no team above 16.
- Since then: 12.4 in 2024-25 and 13.4 in 2025-26, when six teams had the most, 16, and the Calgary Flames and Winnipeg Jets the fewest, 9.
| Season | Back-to-backs per team | Fewest | Most | Points % on the second night |
|---|---|---|---|---|
| 2005-06 | 15.3 | 11 | 19 | 48.1% |
| 2006-07 | 14.7 | 10 | 21 | 52.7% |
| 2007-08 | 15.2 | 9 | 20 | 51.6% |
| 2008-09 | 15.1 | 8 | 20 | 50.0% |
| 2009-10 | 15.1 | 11 | 19 | 54.4% |
| 2010-11 | 15.9 | 11 | 22 | 52.8% |
| 2011-12 | 13.9 | 10 | 21 | 47.8% |
| 2013-14 | 14.7 | 10 | 22 | 54.5% |
| 2014-15 | 13.8 | 9 | 19 | 48.4% |
| 2015-16 | 13.8 | 9 | 18 | 50.4% |
| 2016-17 | 14.8 | 10 | 19 | 54.4% |
| 2017-18 | 13.9 | 9 | 19 | 49.8% |
| 2018-19 | 13.0 | 10 | 17 | 50.7% |
| 2021-22 | 13.6 | 10 | 18 | 48.6% |
| 2022-23 | 12.8 | 7 | 17 | 49.1% |
| 2023-24 | 11.2 | 7 | 16 | 50.7% |
| 2024-25 | 12.4 | 8 | 16 | 45.7% |
| 2025-26 | 13.4 | 9 | 16 | 53.5% |
| 2026-27 (schedule) | 11.8 | 8 | 15 | – |
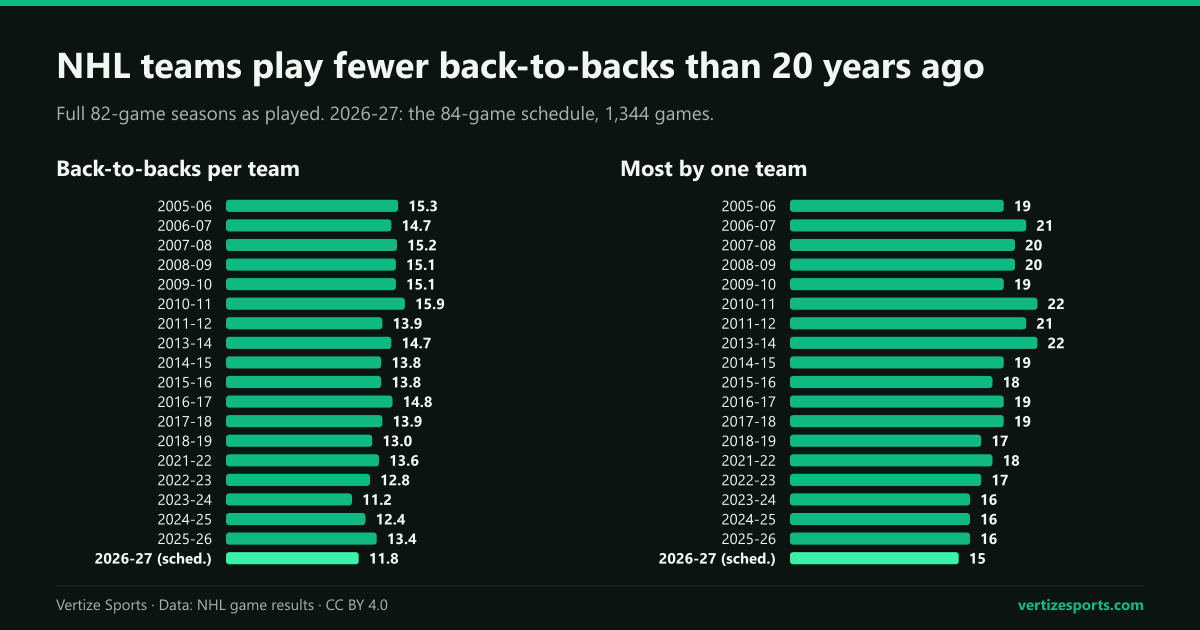
Fewer back-to-backs have not made each one cheaper. From 2005-06 to 2014-15, without 2012-13, teams on the second night took 51.2 percent of the points against 57.0 percent with rest; in the nine full seasons since, 50.4 against 56.6. The gap was 5.8 points in the first period and 6.2 in the second.
Single seasons, with 359 to 476 second nights each, swing more: from 45.7 percent in 2024-25 to 54.5 in 2013-14, with 53.5 last season. In all 18, the second night came out below rested games.
NHL back-to-backs in the 2026-27 schedule, team by team
The 2026-27 season began on Tuesday, September 29 and ends on Saturday, April 10, and it is the first 84-game season since 1993-94. On the full schedule we count 377 back-to-backs, 11.8 per team, or 11.5 for every 82 games: fewer than in any full season since 2005-06 except 2023-24. The Pittsburgh Penguins have the most, 15, and the Calgary Flames and Vegas Golden Knights the fewest, 8, the same figures as the league's schedule stats pack.
| Back-to-backs | Teams |
|---|---|
| 15 | Pittsburgh Penguins |
| 14 | Boston Bruins, Buffalo Sabres, Florida Panthers, Ottawa Senators, Washington Capitals |
| 13 | Columbus Blue Jackets, Dallas Stars, New Jersey Devils, New York Islanders, San Jose Sharks, Seattle Kraken, Tampa Bay Lightning |
| 12 | Carolina Hurricanes, Chicago Blackhawks, Detroit Red Wings, Philadelphia Flyers, St. Louis Blues |
| 11 | Anaheim Ducks, Edmonton Oilers, Nashville Predators, New York Rangers, Toronto Maple Leafs, Vancouver Canucks |
| 10 | Colorado Avalanche, Los Angeles Kings, Minnesota Wild, Montreal Canadiens, Utah Mammoth |
| 9 | Winnipeg Jets |
| 8 | Calgary Flames, Vegas Golden Knights |
Road-road sets make up 173 of the 377, 45.9 percent, and home-home sets 50. At about six points of points percentage per second night, the seven extra back-to-backs Pittsburgh plays compared with Calgary and Vegas are worth less than one standings point over a season.
Through the games of Monday, October 12, 89 of the 1,344 games had been played and teams had already played 22 second nights, going 9-11-2 for 20 of the 44 points available, too small a sample to read much into. The Carolina Hurricanes won both of theirs, the second at the Philadelphia Flyers on October 11, when both teams were on the second night; the Vancouver Canucks lost both of theirs. The other 355 back-to-backs, 14 of them Pittsburgh's, are still to come.
Every game is on the NHL schedule, night by night, and the NHL simulator plays out the rest of the season from the real standings, with every finished game locked.
NHL back-to-backs and rest days: frequently asked questions
What is the NHL record on the second night of a back-to-back? From 2005-06 to 2025-26, teams on the second night took 50.8 percent of the available points and won 44.8 percent of their games. Against a rested opponent they took 48.8 percent.
How many back-to-backs does each NHL team play? About 12. The 2026-27 schedule has 11.8 per team over 84 games, from 8 for Calgary and Vegas to 15 for Pittsburgh. In 2010-11 the average was 15.9.
Are road-road back-to-backs the hardest? They are the most common and among the worst, 47.1 percent of points against rested opponents, but a home-then-road set was about the same, 47.6 percent. What matters most is whether the second game is at home.
How this was built: every regular-season game from 2005-06 to 2025-26 from the NHL's stats API, in date order per team. Days of rest are the days since the team's previous game, minus one; first games of a season are left out. Points percentage counts two points for a win and one for an overtime or shootout loss, and goals leave out the shootout winner the official score adds. Home and road are as the NHL lists them, which includes a few neutral-site games played abroad. Our back-to-back counts match team announcements such as Carolina's (15 in 2024-25 and 2025-26) and the league's 2026-27 figures. The 2026-27 schedule and results were retrieved from the NHL on October 13, 2026, with games through October 12 final.