The Presidents' Trophy goes to the team with the best overall record in the regular season, and it has been handed out every year since 1985-86 except 2004-05, when a lockout over a salary cap canceled the season. To see how its winners fare once the playoffs start, we rebuilt all 600 playoff series since then from the NHL's own game results and matched each one to the final standings.
How often the Presidents' Trophy winner wins the Stanley Cup
Of the 40 winners, 8 won the Cup and 3 more lost in the Final. The rest went out earlier: 8 in the conference final, 13 in the second round and 8 in the first. The second round is the most common stop, and the opposition is the likely reason: the winners' first-round opponents finished 15th in the league on average, their second-round opponents 8th.
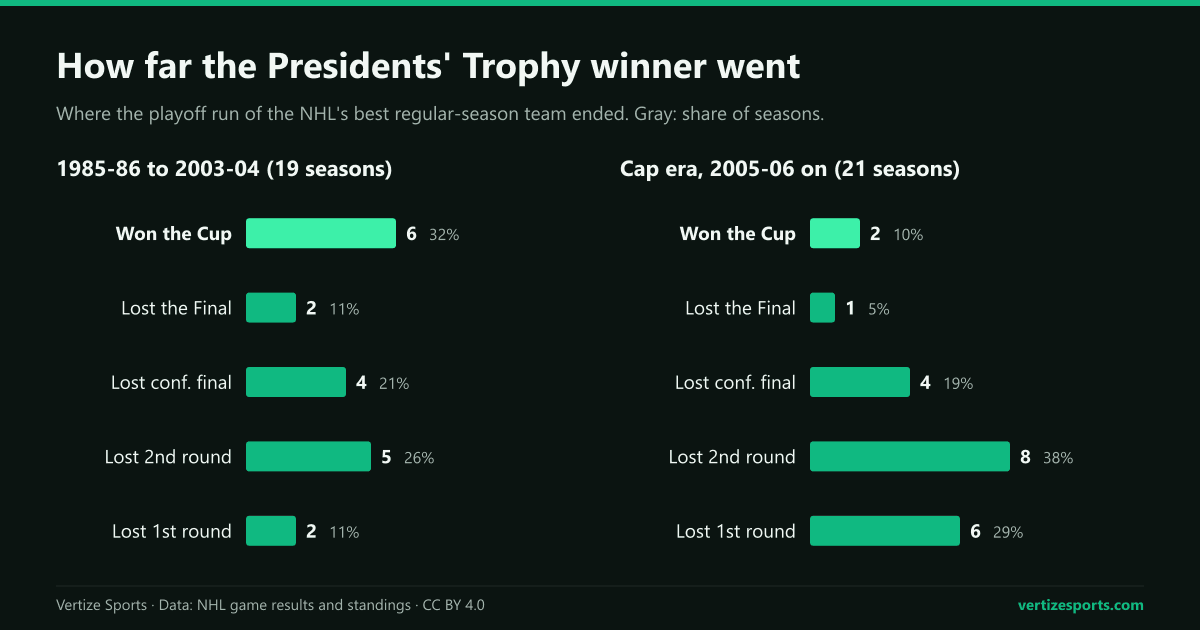
One year in five is still the best rate of any place in the standings. In a 16-team bracket where everyone had the same chance, each team would win the Cup about 6 percent of the time; first place has done it more than three times as often.
Every Presidents' Trophy winner and how its playoffs ended
| Season | Winner | Points | How its playoffs ended |
|---|---|---|---|
| 1985-86 | Edmonton Oilers | 119 | Lost second round to Calgary, 3-4 |
| 1986-87 | Edmonton Oilers | 106 | Won the Cup, beat Philadelphia 4-3 |
| 1987-88 | Calgary Flames | 105 | Lost second round to Edmonton, 0-4 |
| 1988-89 | Calgary Flames | 117 | Won the Cup, beat Montreal 4-2 |
| 1989-90 | Boston Bruins | 101 | Lost the Final to Edmonton, 1-4 |
| 1990-91 | Chicago Blackhawks | 106 | Lost first round to Minnesota North Stars, 2-4 |
| 1991-92 | New York Rangers | 105 | Lost second round to Pittsburgh, 2-4 |
| 1992-93 | Pittsburgh Penguins | 119 | Lost second round to NY Islanders, 3-4 |
| 1993-94 | New York Rangers | 112 | Won the Cup, beat Vancouver 4-3 |
| 1994-95 | Detroit Red Wings | 70 in 48 games | Lost the Final to New Jersey, 0-4 |
| 1995-96 | Detroit Red Wings | 131 | Lost conference final to Colorado, 2-4 |
| 1996-97 | Colorado Avalanche | 107 | Lost conference final to Detroit, 2-4 |
| 1997-98 | Dallas Stars | 109 | Lost conference final to Detroit, 2-4 |
| 1998-99 | Dallas Stars | 114 | Won the Cup, beat Buffalo 4-2 |
| 1999-00 | St. Louis Blues | 114 | Lost first round to San Jose, 3-4 |
| 2000-01 | Colorado Avalanche | 118 | Won the Cup, beat New Jersey 4-3 |
| 2001-02 | Detroit Red Wings | 116 | Won the Cup, beat Carolina 4-1 |
| 2002-03 | Ottawa Senators | 113 | Lost conference final to New Jersey, 3-4 |
| 2003-04 | Detroit Red Wings | 109 | Lost second round to Calgary, 2-4 |
| 2005-06 | Detroit Red Wings | 124 | Lost first round to Edmonton, 2-4 |
| 2006-07 | Buffalo Sabres | 113 | Lost conference final to Ottawa, 1-4 |
| 2007-08 | Detroit Red Wings | 115 | Won the Cup, beat Pittsburgh 4-2 |
| 2008-09 | San Jose Sharks | 117 | Lost first round to Anaheim, 2-4 |
| 2009-10 | Washington Capitals | 121 | Lost first round to Montreal, 3-4 |
| 2010-11 | Vancouver Canucks | 117 | Lost the Final to Boston, 3-4 |
| 2011-12 | Vancouver Canucks | 111 | Lost first round to Los Angeles, 1-4 |
| 2012-13 | Chicago Blackhawks | 77 in 48 games | Won the Cup, beat Boston 4-2 |
| 2013-14 | Boston Bruins | 117 | Lost second round to Montreal, 3-4 |
| 2014-15 | New York Rangers | 113 | Lost conference final to Tampa Bay, 3-4 |
| 2015-16 | Washington Capitals | 120 | Lost second round to Pittsburgh, 2-4 |
| 2016-17 | Washington Capitals | 118 | Lost second round to Pittsburgh, 3-4 |
| 2017-18 | Nashville Predators | 117 | Lost second round to Winnipeg, 3-4 |
| 2018-19 | Tampa Bay Lightning | 128 | Lost first round to Columbus, 0-4 |
| 2019-20 | Boston Bruins | 100 in 70 games | Lost second round to Tampa Bay, 1-4 |
| 2020-21 | Colorado Avalanche | 82 in 56 games | Lost second round to Vegas, 2-4 |
| 2021-22 | Florida Panthers | 122 | Lost second round to Tampa Bay, 0-4 |
| 2022-23 | Boston Bruins | 135 | Lost first round to Florida, 3-4 |
| 2023-24 | New York Rangers | 114 | Lost conference final to Florida, 2-4 |
| 2024-25 | Winnipeg Jets | 116 | Lost second round to Dallas, 2-4 |
| 2025-26 | Colorado Avalanche | 121 | Lost conference final to Vegas, 0-4 |
Points do not compare cleanly across eras. Seasons ran 80 games until 1991-92 and 84 in the next two, four were shorter, ties lasted until 2003-04, and since 1999-2000 a loss in overtime has been worth a point.
The Presidents' Trophy curse in the salary-cap era
The curse is mostly a story of the last two decades. Before the lockout, the Cup was the most common ending for a winner: 6 of 19, 32 percent. Since the salary cap arrived in 2005-06, 2 of 21 have won it, 10 percent: the Detroit Red Wings in 2007-08 and the Blackhawks in 2012-13. The 13 seasons since are the longest drought, more than three times the previous record of four, and none of those 13 winners reached the Final.
Early exits have become common too. Only 2 of the 19 winners before the lockout lost in the first round, against 6 of the 21 since. Four of those stand out:
- 2009-10: the Washington Capitals, 121 points, lost a 3-1 lead to a Montreal Canadiens team that finished 19th, the lowest-placed team to knock out a winner.
- 2011-12: the Vancouver Canucks, 111 points, lost in five to the Los Angeles Kings, 13th in the league, who went on to win the Cup.
- 2018-19: the Tampa Bay Lightning, 128 points, were swept by the Columbus Blue Jackets, the only first-round sweep of a winner.
- 2022-23: the Boston Bruins, 135 points, the most of any winner, also lost a 3-1 lead, to a Florida Panthers team 43 points worse, the widest gap between a winner and the team that knocked it out.
Many simply ran into the eventual champion. Of the 32 winners that fell short, 14 lost to the team that went on to lift the Cup, 3 of them in the Final.
Why the best regular-season team rarely wins the Cup
The arithmetic of four rounds explains most of it. Presidents' Trophy winners have won 70 of their 102 playoff series, 69 percent. A team that wins each series that often wins four in a row 22 percent of the time, close to the 20 percent the winners have managed.
What changed after the lockout is that one number. Before it, the winners took 77 percent of their series, which compounds to a 35 percent chance of a Cup; they won 32 percent. Since then they have taken 59 percent, which compounds to 12 percent; they have won 10 percent. The whole bracket moved the same way: the team with the better regular-season record won 65 percent of playoff series before the cap and 56 percent after it.
A more dominant regular season does not buy more, either. The eight winners that went on to lift the Cup averaged a .711 points percentage, and the 32 that did not averaged .711 as well. The 2022-23 Bruins had the best mark of all 40, .823, and went out in the first round.
How the Presidents' Trophy winner compares with the next-best teams
None of this makes first place a disadvantage. Set against the teams that finished second, third and fourth over the same 40 seasons, the Presidents' Trophy winner has won the most Cups and the most series, reached the most Finals and lost in the first round least often.
| Regular-season finish | Won the Cup | Reached the Final | Out in first round | Series won |
|---|---|---|---|---|
| 1st (Presidents' Trophy) | 8 | 11 | 8 | 70 |
| 2nd | 5 | 7 | 12 | 56 |
| 3rd | 3 | 6 | 13 | 48 |
| 4th | 6 | 9 | 19 | 48 |
The salary-cap era is the exception in the Cup column. Since 2005-06 the team in second has won three Cups to the winner's two, the Pittsburgh Penguins in 2016-17, Colorado in 2021-22 and the Carolina Hurricanes last season, and the team in fourth has won four.
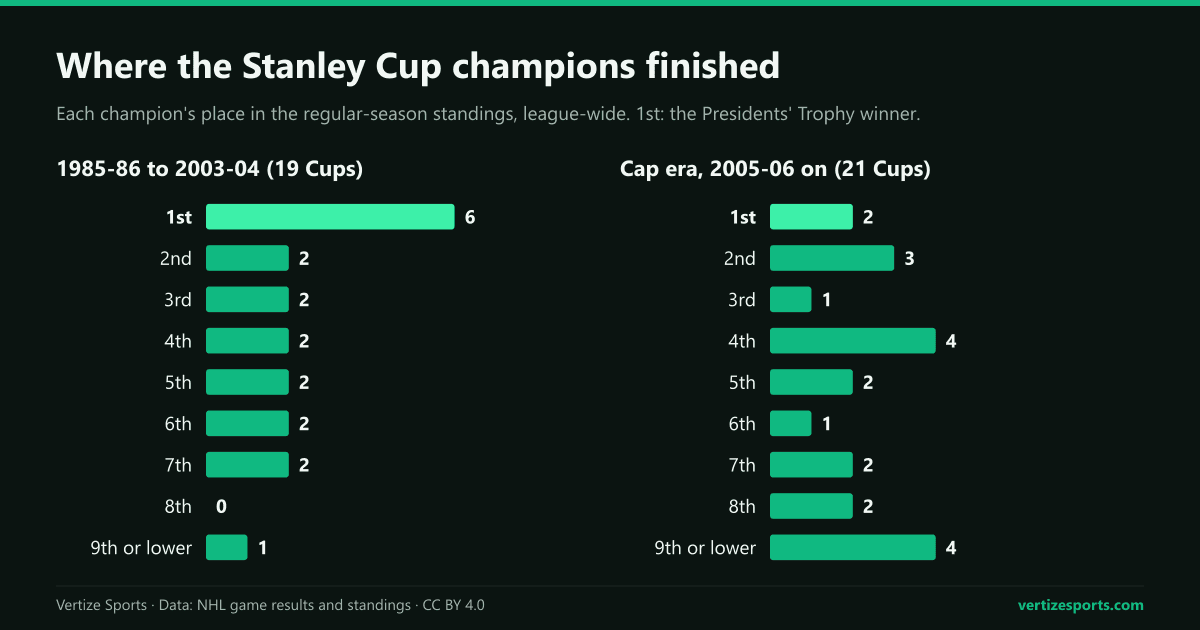
The champions now come from further down the standings. Before the lockout the median champion finished third, and only one finished below eighth, the 1994-95 New Jersey Devils. Since 2005-06 the median champion has finished fifth, and four came from ninth or lower: the Kings twice, the St. Louis Blues in 2018-19 and the Panthers in 2024-25.
Colorado, Carolina and the 2026-27 Presidents' Trophy race
Last season followed the pattern. Colorado won the trophy with 121 points and a 55-16-11 record, swept the Los Angeles Kings, beat the Minnesota Wild in five and then lost four straight to Vegas, 13th in the league. Vegas lost the Final in six to Carolina, the league's second-best team with 113 points and the fifth runner-up for the Presidents' Trophy to win the Cup.
The 2026-27 season opens on Tuesday, September 29 with five games, Florida at Carolina first, and it is the league's first 84-game season since 1993-94. Our preseason projections make Colorado the favorite to finish first again, in 68 percent of 10,000 simulated seasons; history gives that team about a one-in-five shot at the Cup, closer to one in ten since 2005-06. Play the season out in the NHL simulator and follow it on the NHL schedule.
Presidents' Trophy and Stanley Cup: frequently asked questions
How many Presidents' Trophy winners have won the Stanley Cup? Eight of 40: the Edmonton Oilers in 1986-87, the Calgary Flames in 1988-89, the New York Rangers in 1993-94, the Dallas Stars in 1998-99, Colorado in 2000-01, Detroit in 2001-02 and 2007-08 and Chicago in 2012-13.
When did a Presidents' Trophy winner last win the Stanley Cup? In 2013, when the Chicago Blackhawks won both after the 48-game 2012-13 season. None of the 13 winners since has reached the Final.
Is the Presidents' Trophy curse real? Not as a curse. The winner still wins the Cup and reaches the Final more often than the team in any other place in the standings, but it has to win four playoff rounds, and since 2005-06 it has won only 59 percent of its series.
Who won the Presidents' Trophy in 2025-26? The Colorado Avalanche, with 121 points, eight more than Carolina. Colorado was swept by Vegas in the Western Conference Final, and Carolina won the Cup.
Which team has won the most Presidents' Trophies? The Detroit Red Wings, with six. The Boston Bruins, the Rangers and the Avalanche have four each, and Detroit is the only team to win the trophy and the Cup in the same season twice.
How this was built: final standings for all 40 seasons from 1985-86 to 2025-26 from the NHL's standings API, with the league's tiebreakers, and all 3,480 playoff games from its stats API, rebuilt into the 600 series of the four main rounds by the round and series number in each game ID. The 2020 qualifying round and round robin, where Boston played three games, are left out. Winners and runners-up match the NHL's official records, points match NHL.com's list and playoff results match Wikipedia's. Better-team comparisons use points percentage and skip 18 series between teams level on it.