We counted every NHL regular-season game since 1917-18 in the league's stats API, 65,242 games, plus every playoff game, from the side of the team the league lists as home. The 50 games played at neutral sites are left out: 48 in Japan and Europe, matched against the list of NHL international games, and two outdoors at Lake Tahoe in 2021. In the goal margin, a shootout counts as a tie.
For 2025-26 alone, home teams won 685 of 1,312 games, the 52.2 percent in our one-season comparison of six leagues, where hockey had the smallest home edge of the six. Without the two games in Stockholm it is 683 of 1,310, with a margin of 0.13 goals.
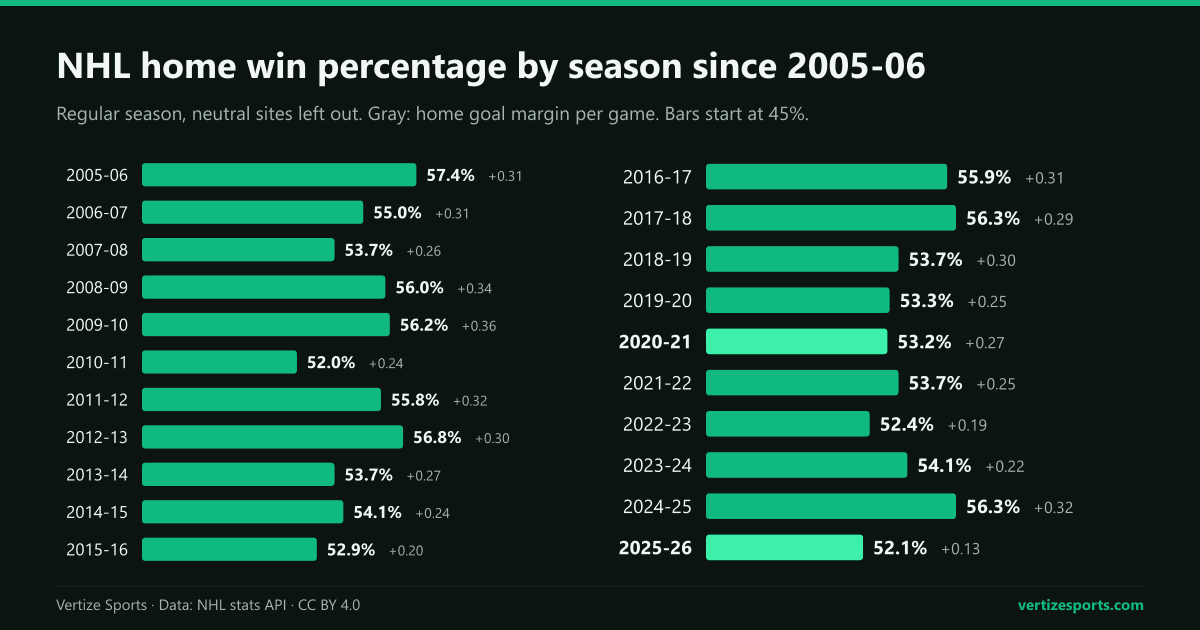
NHL home win percentage by season since 2005-06
Since the shootout ended ties, home teams have won between 52.0 and 57.4 percent of games in every season and taken between 57.9 and 62.7 percent of the points. The best season for hosts was the first, 2005-06. The two worst were 2010-11, at 52.0 percent, and 2025-26, at 52.1.
| Seasons | Games | Home W-L-OTL | Home win % | Home points % | Goal margin |
|---|---|---|---|---|---|
| 2005-06 to 2009-10 | 6,140 | 3,417-2,027-696 | 55.7% | 61.3% | +0.32 |
| 2010-11 to 2014-15 | 5,630 | 3,056-1,896-678 | 54.3% | 60.3% | +0.27 |
| 2015-16 to 2018-19 | 4,997 | 2,735-1,716-546 | 54.7% | 60.2% | +0.28 |
| 2019-20 (paused in March) | 1,079 | 575-366-138 | 53.3% | 59.7% | +0.25 |
| 2020-21 (mostly empty arenas) | 866 | 461-302-103 | 53.2% | 59.2% | +0.27 |
| 2021-22 to 2025-26 | 6,546 | 3,516-2,337-693 | 53.7% | 59.0% | +0.22 |
| All 21 seasons | 25,258 | 13,760-8,644-2,854 | 54.5% | 60.1% | +0.27 |
The margin tells the clearer story: 0.32 goals a game from 2005-06 to 2009-10, 0.22 from 2021-22 to 2025-26. The 0.13 of 2025-26 is the smallest of any season since 1917-18. The next smallest are 0.18, in 1962-63 and 1997-98.
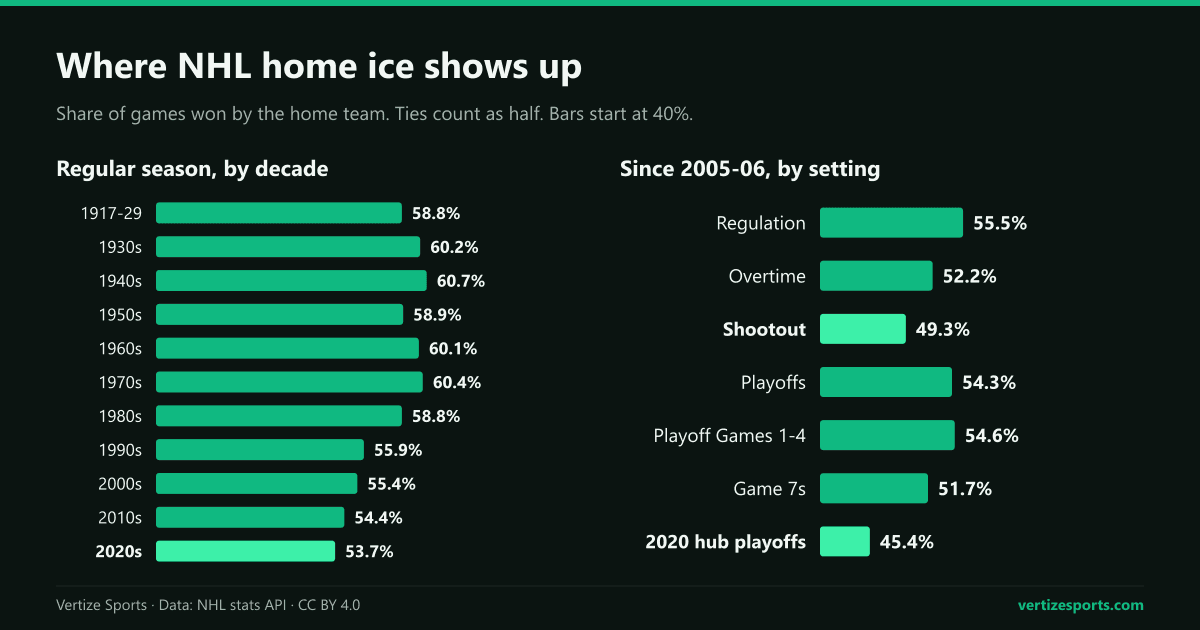
A long decline: home ice by decade since 1917
Counting a tie as half a win, home teams won at least 58.8 percent of their games in every decade through the 1980s, with a peak of 60.7 percent in the 1940s. The share then fell decade by decade: 55.9 percent in the 1990s, 55.4 in the 2000s, 54.4 in the 2010s and 53.7 in the 2020s so far. The goal margin fell faster, from 0.78 a game in the 1970s to 0.23 in the 2020s, a drop of 71 percent.
Other leagues have lost ground too. NBA home teams won 55.3 percent of games over the last five seasons, down from 60.2 percent from 1996-97 to 2012-13, and NFL home teams won 57.5 percent from 1999 to 2018 and 53.2 percent since.
Overtime and the shootout: where home ice disappears
The edge is a regulation edge. Since 2005-06, home teams have won 10,801 of the 19,445 games decided in 60 minutes, 55.5 percent, but only 1,678 of 3,212 decided in overtime, 52.2 percent. In the shootout they are 1,281-1,320, 49.3 percent, even though the rulebook lets the home team choose whether to shoot first or second.
The 2020-21 empty arenas and the 2020 playoff bubble
The 2019-20 season stopped in March 2020 with home teams on 53.3 percent. The playoffs resumed that summer in two hub cities, Toronto and Edmonton, with no fans, and one team in each game listed as the home side. Those designated hosts went 59-71, 45.4 percent, and 36-50 once the 16-team rounds began.
Then came a 56-game season with every game inside a division, one of them made up of the seven Canadian teams. None of those seven admitted the public in the regular season, and only three US teams, Arizona, Dallas and Florida, had fans from the start, under capacity limits. Home teams still won 53.2 percent of games, close to the seasons around it: 52.0 percent in the all-Canadian division and 53.6 in the three US divisions.
Where the empty arenas did show was in the penalty box. In the league's home and road splits, home teams drew between 0.17 and 0.54 more power plays a game than visitors in every season from 1997-98 on, except one. In 2020-21 the gap shrank to 0.06, 2.92 against 2.86, and home teams got 50.5 percent of the power plays, their lowest share in 28 seasons. In 2025-26, with full arenas, it was 3.00 against 2.76.
Home ice in the NHL playoffs vs. the regular season
Home ice is worth no more in the playoffs. Leaving out the 2020 hub cities, home teams have won 942 of 1,734 playoff games since 2006, 54.3 percent, against 54.5 percent in the regular season. Because the higher seed hosts up to four games of seven, the fairer test is Games 1 to 4, where each team hosts twice: there, home teams are 655-545, 54.6 percent.
- Game 1, hosted by the higher seed: 181-119, 60.3 percent.
- Games 3 and 4, hosted by the lower seed: 306-294, 51.0 percent.
- Game 7s: 45-42 since 2006, 51.7 percent, and 118-85 over all of NHL history, 58 percent.
Baseball looks the same: MLB home teams have won 54.0 percent of postseason games since 1995, against 53.7 in the regular season.
Last change and faceoffs: the rules that favor the home team
Under Rule 82.1 of the NHL's 2025-26 rulebook, after a stoppage the visiting team must put its players on the ice first, and the home team may then change as it wants, except after an icing. That is the last change: the home coach picks the matchup. Under Rule 76.4, the visiting center must put his stick down first on a faceoff at center ice; at the other eight dots the defending center goes first, home or away.
The faceoff numbers lean the home team's way, by a little. Home teams won between 51.0 and 52.1 percent of faceoffs in every season from 1997-98 to 2019-20. Since 2020-21 the share has stayed below 51.2 percent, and in 2025-26 it was 50.4, the lowest of the 28 seasons. The records do not say why.
Best and worst home-ice advantage by team
A home record mostly measures how good a team is, so the fairer test is the gap between its points percentage at home and on the road. Across the league since 2005-06 that gap is 8.7 points: 60.1 percent at home, 51.4 on the road, where overtime losses still bring a point. The Tampa Bay Lightning lead the 29 franchises that played all 21 seasons at 13.4 points, ahead of the Florida Panthers at 11.9 and the Minnesota Wild at 11.5.
| Rank | Team | Home W-L-OTL | Road W-L-OTL | Home pts % | Road pts % | Gap (pts) |
|---|---|---|---|---|---|---|
| 1 | Tampa Bay Lightning | 505-244-73 | 389-349-86 | 65.9% | 52.4% | +13.4 |
| 2 | Florida Panthers | 446-267-109 | 356-372-93 | 60.9% | 49.0% | +11.9 |
| 3 | Minnesota Wild | 478-251-94 | 387-349-86 | 63.8% | 52.3% | +11.5 |
| 4 | Columbus Blue Jackets | 420-313-91 | 322-401-99 | 56.5% | 45.2% | +11.3 |
| 5 | Calgary Flames | 460-277-86 | 364-362-101 | 61.1% | 50.1% | +11.0 |
| 27 | St. Louis Blues | 457-280-87 | 392-327-106 | 60.7% | 53.9% | +6.8 |
| 28 | Edmonton Oilers | 409-334-81 | 357-375-94 | 54.6% | 48.9% | +5.6 |
| 29 | New York Rangers | 454-285-86 | 423-314-84 | 60.2% | 56.6% | +3.6 |
| League | 13,760-8,644-2,854 | 11,498-10,801-2,959 | 60.1% | 51.4% | +8.7 |
The New York Rangers gained the least, 3.6 points, mostly because they have been good on the road: their 56.6 percent away is second only to the Boston Bruins. Altitude, which lifts the Denver Nuggets in basketball, does nothing special for the Colorado Avalanche, whose gap of 8.6 points is almost exactly the league's.
The best home season since 2005-06 belongs to the 2022-23 Boston Bruins, 34-4-3, and the worst to the 2025-26 Vancouver Canucks, 9-27-5. The longest home winning streak within a regular season since 1917-18 is the Detroit Red Wings' 23 in a row, from November 5, 2011, to February 19, 2012.
Travel and time zones barely move the needle
With team strength taken out (each game's margin minus the gap between the two teams' average goal differentials that season), home teams in the Pacific zone beat Eastern visitors by 0.33 goals, over 1,306 games, against 0.26 when both teams share a time zone and 0.26 when a Pacific team traveled east. That difference is within what chance alone produces in samples this size, and the home win rate barely moves, 55.0 percent against 54.4.
Home ice in the 2026-27 NHL season
Through October 12, home teams had won 49 of the first 89 games of 2026-27, 55.1 percent, with a 49-35-5 record and 57.9 percent of the points, too few games to read anything into. Four games will be played away from either team's arena: the Carolina Hurricanes and the Seattle Kraken in Helsinki on November 12 and 14, and the Chicago Blackhawks and the Ottawa Senators in Dusseldorf on December 18 and 20, each team hosting once.
Our NHL season simulator gives every home team a head start of 0.13 goals, what home ice was worth in 2025-26, and the NHL standings show each team's home and road record as the season goes.
NHL home-ice advantage: frequently asked questions
How much is home-ice advantage worth in the NHL? About a quarter of a goal a game since 2005-06, 0.27 goals, and 0.13 in 2025-26, when home teams won 52.1 percent of games.
Is home ice bigger in the NHL playoffs? No. Since 2006 home teams have won 54.3 percent of playoff games outside the 2020 hub cities, against 54.5 percent in the regular season.
What is the home team's record in NHL Game 7s? 118-85 through the 2026 playoffs, 58 percent, but 45-42 since 2006.
Which NHL team has the best home-ice advantage? The Tampa Bay Lightning, whose points percentage has been 13.4 points higher at home than on the road since 2005-06.
How this was built: every NHL regular-season game from 1917-18 to 2025-26, every playoff game through 2026 and the finished 2026-27 games through October 12, from the NHL's stats API, with the home team the one the league lists. Left out: the 48 regular-season games in Japan and Europe from 1997 to 2025, matched by date and teams against Wikipedia's list, and the two Lake Tahoe games of 2021; earlier neutral-site games in North America could not be identified and are counted. Margins count a shootout as a tie. Strength-adjusted margins subtract the difference between the two teams' average goal differentials that season; time zones are each arena's standard zone. Power plays and faceoffs come from the league's home and road team splits, 1997-98 to 2025-26. Games 1 to 4 use the best-of-seven series from 2006 to 2026 in which each team hosted two of them.