We took the NHL's game-by-game team statistics, the same figures NHL.com publishes, for all 25,302 regular-season games from 2005-06, the first season without ties, to 2025-26, and compared each side's shots on goal with the result. Another 968 games ended with even shots. Counting the point for an overtime loss, the team with more shots took 57.4 percent of the points available.
How often outshooting wins NHL games, by shot margin
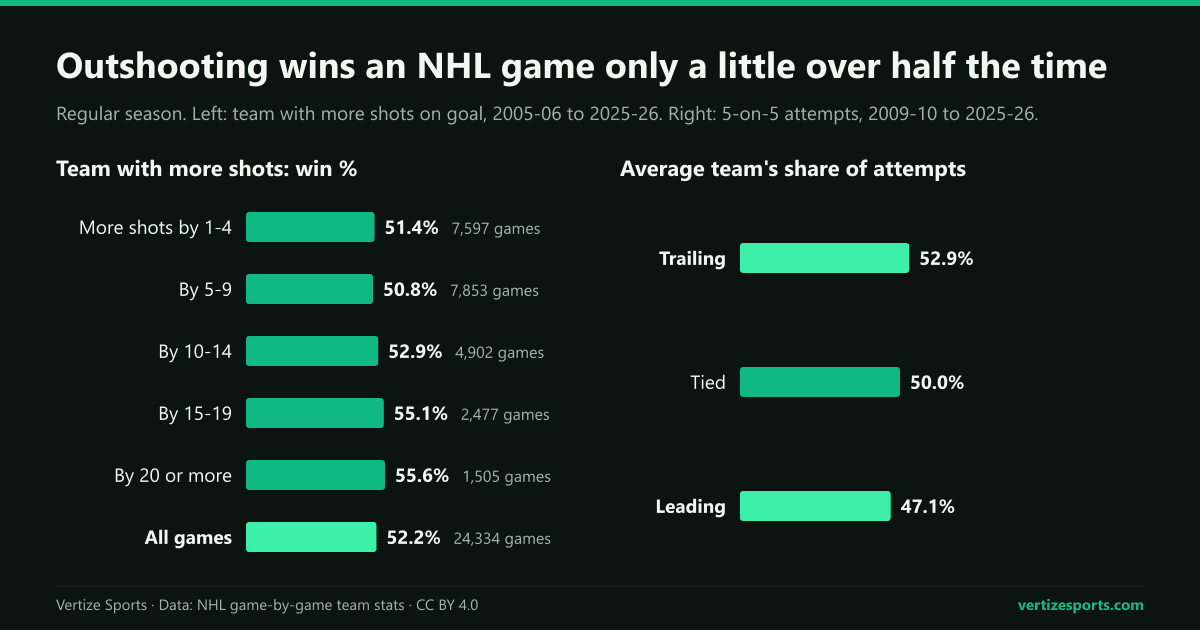
A small edge in shots means almost nothing. Teams with 1 to 4 more shots than their opponent won 51.4 percent of the time, and teams with 5 to 9 more won 50.8 percent. The rate passed 55 percent only with 15 or more, and even a gap of 20 shots or more won 55.6 percent of the time.
| Shot margin | Games | Win % | Points % |
|---|---|---|---|
| 1 to 4 | 7,597 | 51.4% | 56.6% |
| 5 to 9 | 7,853 | 50.8% | 56.3% |
| 10 to 14 | 4,902 | 52.9% | 58.0% |
| 15 to 19 | 2,477 | 55.1% | 59.9% |
| 20 or more | 1,505 | 55.6% | 60.4% |
| All | 24,334 | 52.2% | 57.4% |
Venue matters more than the margin. Home teams that outshot their opponent won 55.8 percent of the time, road teams 47.4 percent, and the home team had more shots in 56.9 percent of these games. In games settled in regulation, the team with more shots won 51.4 percent; in shootouts, 49.8 percent.
Score effects: why NHL teams that trail outshoot the leaders
In the NHL's five-on-five shot attempt figures, which count shots on goal, missed shots and blocked shots from 2009-10 on, the average team took 52.9 percent of the attempts while trailing, 50.0 percent while tied and 47.1 percent while leading. In 2025-26 teams with a lead were out-attempted by 2.66 a game at five-on-five.
That is why winners are so often outshot. Winners had fewer shots than the loser in 46.0 percent of all games. In games decided in regulation by one goal, the winner was outshot 54.2 percent of the time and took 48.8 percent of the shots; winners by four goals or more took 52.6 percent and were outshot 36.4 percent of the time. A lead counts for far more than shots: the team that scores first wins about two games in three.
Score effects also explain the swings between seasons. The team with more shots won 47.1 percent of the time in 2010-11 and 57.1 percent in 2021-22, and in six of the 21 seasons it won less than half. Across the 17 seasons with attempt data, that rate was higher in seasons when leading teams were outshot by less, a correlation of 0.75: leaders were out-attempted by 3.81 a game in 2010-11 and by only 1.13 in 2021-22.
The most lopsided NHL games won by the team with fewer shots
The biggest gap came on January 5, 2023, when the Carolina Hurricanes outshot the Nashville Predators 67-25 at home and lost 5-3. Juuse Saros made 64 saves, a Predators record, and Carolina's 67 shots are the most by any team in a regular-season game since 2005-06. Seven of the eight biggest gaps were won by the road team:
| Date | Winner | Loser | Score | Shots |
|---|---|---|---|---|
| Jan. 5, 2023 | Nashville Predators (road) | Carolina Hurricanes | 5-3 | 25-67 |
| Nov. 23, 2009 | New York Islanders (road) | Toronto Maple Leafs | 4-3 (OT) | 21-61 |
| April 10, 2010 | Edmonton Oilers (road) | Los Angeles Kings | 4-3 (SO) | 16-55 |
| April 5, 2007 | Chicago Blackhawks | Detroit Red Wings | 3-2 (SO) | 21-58 |
| Feb. 25, 2023 | Anaheim Ducks (road) | Carolina Hurricanes | 3-2 | 16-53 |
| Feb. 28, 2023 | Boston Bruins (road) | Calgary Flames | 4-3 (OT) | 20-57 |
| Dec. 4, 2014 | Columbus Blue Jackets (road) | Florida Panthers | 4-3 (SO) | 20-55 |
| March 27, 2009 | Edmonton Oilers (road) | Anaheim Ducks | 5-3 | 20-54 |
Since 2005-06 a team outshot by 20 or more has won 668 times, and by 30 or more 48 times.
NHL shots per game by season
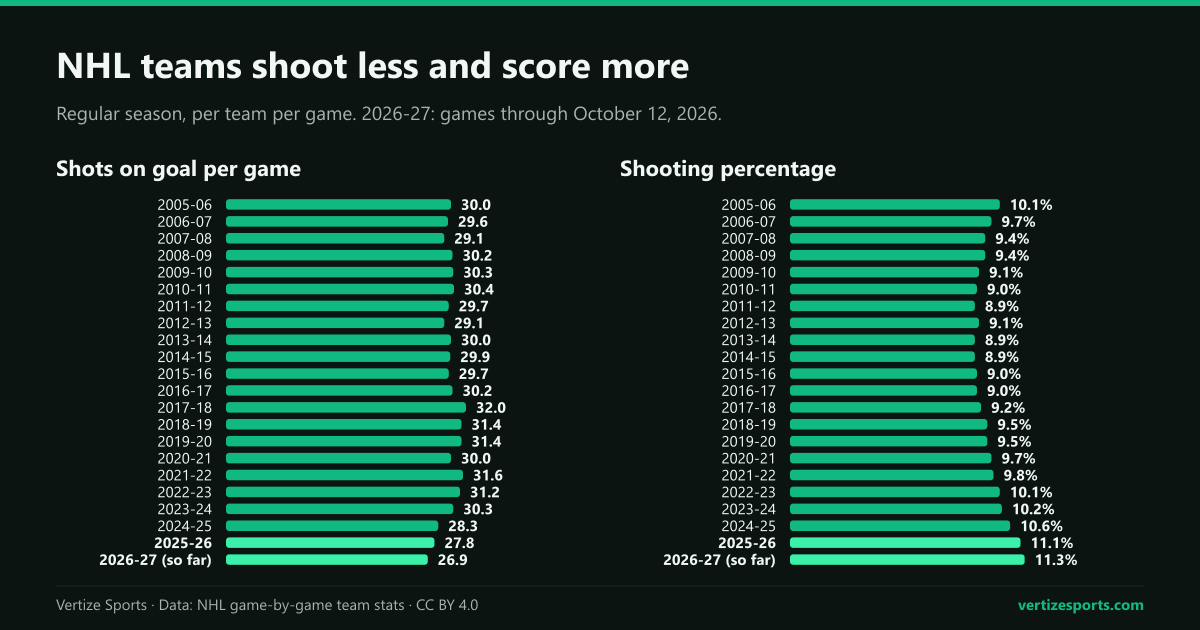
NHL teams averaged 27.83 shots on goal per game in 2025-26, the fewest of the 21 seasons since 2005-06 and, in the NHL's records, which start in 1959-60, the fewest since 2001-02's 27.58. The peak of the 21 seasons was 31.95 in 2017-18, and teams have taken 3.79 fewer shots a game since 2021-22. Over 66 seasons the league has moved in a narrow band, from 27.34 in 1997-98 to 32.82 in 1963-64.
Fewer shots have come with more goals. Shooting percentage reached 11.07 percent in 2025-26, the highest of the 21 seasons and the highest since 1992-93, and the share of shots stopped fell to .889, from .911 in 2013-14. That is how games kept averaging 6.16 goals in 2025-26, as our count of NHL goals per game by season shows.
| Season | Shots per team | Shooting % | Save % | More shots won |
|---|---|---|---|---|
| 2025-26 | 27.83 | 11.07% | .889 | 51.6% |
| 2024-25 | 28.27 | 10.65% | .894 | 56.0% |
| 2023-24 | 30.29 | 10.17% | .898 | 53.7% |
| 2022-23 | 31.24 | 10.06% | .899 | 56.9% |
| 2021-22 | 31.63 | 9.82% | .902 | 57.1% |
| 2020-21 | 29.97 | 9.67% | .903 | 53.9% |
| 2019-20 | 31.41 | 9.49% | .905 | 48.5% |
| 2018-19 | 31.45 | 9.48% | .905 | 50.7% |
| 2017-18 | 31.95 | 9.17% | .908 | 50.6% |
| 2016-17 | 30.22 | 9.02% | .910 | 50.4% |
| 2015-16 | 29.73 | 8.98% | .910 | 48.3% |
| 2014-15 | 29.92 | 8.90% | .911 | 52.5% |
| 2013-14 | 30.04 | 8.89% | .911 | 49.8% |
| 2012-13 | 29.14 | 9.11% | .909 | 53.2% |
| 2011-12 | 29.75 | 8.94% | .911 | 49.7% |
| 2010-11 | 30.39 | 8.99% | .910 | 47.1% |
| 2009-10 | 30.31 | 9.12% | .909 | 49.7% |
| 2008-09 | 30.20 | 9.43% | .906 | 53.3% |
| 2007-08 | 29.07 | 9.36% | .906 | 53.2% |
| 2006-07 | 29.58 | 9.73% | .903 | 54.0% |
| 2005-06 | 29.98 | 10.09% | .899 | 54.7% |
PDO, luck and skill: shot share against points percentage
PDO adds a team's shooting percentage and save percentage and multiplies by 100, so the league average is 100. Over a season it tracks the standings closely, more closely than shot share does, but it does not last. Across 644 team-seasons since 2005-06, a team's share of the shots correlated with its points percentage at 0.61 and PDO at 0.76; from one season to the next, shot share repeated at 0.63 and PDO at only 0.36.
| Team measure | Same season: points % | Next season: same measure | Next season: points % |
|---|---|---|---|
| Shot share | 0.61 | 0.63 | 0.47 |
| PDO | 0.76 | 0.36 | 0.34 |
| Goal differential per game | 0.95 | 0.55 | 0.54 |
| Points percentage | – | 0.51 | 0.51 |
The extremes show the difference. The tenth of teams with the highest PDO, 102.3 on average, took 67.1 percent of the points; the next season their PDO was 100.9 and their points percentage 60.4. The tenth with the highest shot share, 54.8 percent, still had 53.3 percent the next season and lost much less ground in the standings:
| Top or bottom tenth | That season | Next season | Points %, that season | Points %, next season |
|---|---|---|---|---|
| Highest PDO | 102.3 | 100.9 | 67.1% | 60.4% |
| Lowest PDO | 97.7 | 99.2 | 42.2% | 49.6% |
| Highest shot share | 54.8% | 53.3% | 63.6% | 61.7% |
| Lowest shot share | 45.3% | 46.9% | 44.0% | 46.3% |
Shot share is not the whole story. Goal differential predicted the next season's points percentage a little better, 0.54 against 0.47, because shooting and goaltending are partly skill too: shooting and save percentage each repeated at 0.48, more than PDO as a whole. Our 2026-27 NHL projections start from last season's goal differential. The NHL's five-on-five figures agree: since 2009-10, PDO repeated at 0.31 and shot attempt share at 0.67.
The 2022-23 Boston Bruins had the highest PDO of the 21 seasons, 104.0, with a 52.5 percent shot share, on the way to 135 points, the most in that span. The 2023-24 Philadelphia Flyers had 54.9 percent of the shots, a PDO of 96.9 and 87 points.
Shots on goal in 2025-26 and 2026-27
In 2025-26 the Carolina Hurricanes had the league's highest shot share, 57.3 percent, the fifth-highest of any team since 2005-06, and 113 points. The Colorado Avalanche were second at 56.3 percent and, with a PDO of 101.6, finished with a league-high 121 points. The Toronto Maple Leafs had the lowest share, 44.8 percent, and 78 points; the Vancouver Canucks, at 46.5 percent and with the league's lowest PDO, 97.0, finished last with 58.
The 2026-27 season opened on September 29, and 89 of its 1,344 games were final through Monday, October 12. Teams have averaged 26.85 shots a game, and the team with more shots won 49 of the 85 games with a shot edge. The Carolina Hurricanes lead in shot share again at 59.8 percent and are 5-1-1; the Philadelphia Flyers, at 36.3 percent, are 0-5-2. The Calgary Flames, 0-5-0, have a PDO of 86.8, far below 96.0, the lowest of any team in a season since 2005-06. Four to seven games a team say little about a season.
The NHL standings update after every game night, and the NHL simulator plays out the rest of the season from the real standings, with every finished game locked.
NHL shots on goal: frequently asked questions
Does outshooting win NHL games? Only a little more often than not. The team with more shots on goal won 52.2 percent of regular-season games from 2005-06 to 2025-26, and 55.6 percent even with a gap of 20 shots or more.
How many shots per game do NHL teams average? 27.83 per team in 2025-26, the fewest since 2001-02, or 55.66 for both teams.
What is PDO in hockey? Shooting percentage plus save percentage, times 100. The league average is 100, and teams far from it usually drift back the next season.
Why do teams that are behind outshoot teams that are ahead? The trailing team pushes forward and the leading team protects the lead. At five-on-five the average team took 52.9 percent of shot attempts while trailing and 47.1 percent while leading.
How this was built: one row per regular-season game from the NHL stats API's team summary report, 2005-06 to 2025-26 plus the 2026-27 games final through October 12, 2026, with shots on goal for both teams, matched to the NHL's game results; each team's points match the official final standings for all 21 seasons. Goals for shooting percentage leave out the shootout winner the final score adds; save percentage is one minus shooting percentage, so empty-net goals count against it and it runs slightly below goalies' official figure. Shots per game before 2005-06 and the five-on-five attempt and PDO figures by score come from the NHL's season team reports; the five-on-five report misses one Florida-Tampa Bay game in 2009-10. Correlations are Pearson coefficients; consecutive seasons are matched by franchise.