We took every Premier League result since 1995-96, the first season football-data.co.uk has half-time scores for, through 2025-26: 11,780 games. The 6,840 since 2008-09 match the league's own match records score for score, half-time included. The teams were level at the break in 4,849 games, 41 percent, so 59 percent had a half-time leader.
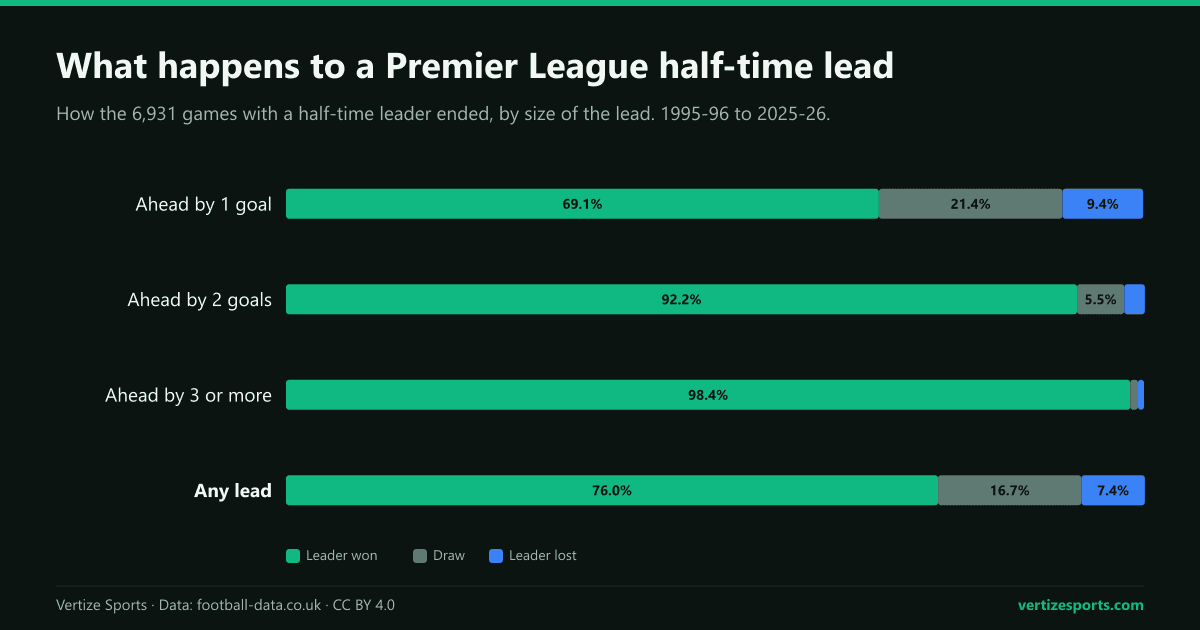
Premier League half-time lead win percentage, by size of the lead
The size of the lead decides most of it. A one-goal lead at the break became a win 69 percent of the time and a defeat 9.4 percent; a two-goal lead was won 92 percent of the time, and a lead of three or more 421 of 428 times.
| Lead at half-time | Games | Leader won | Draw | Leader lost |
|---|---|---|---|---|
| 1 goal | 4,985 | 3,445 (69.1%) | 1,069 (21.4%) | 471 (9.4%) |
| 2 goals | 1,518 | 1,399 (92.2%) | 83 (5.5%) | 36 (2.4%) |
| 3 goals or more | 428 | 421 (98.4%) | 4 (0.9%) | 3 (0.7%) |
| Any lead | 6,931 | 5,265 (76.0%) | 1,156 (16.7%) | 510 (7.4%) |
Home and away half-time leads
Where the lead is held matters too. Home teams led at half-time 4,151 times and won 80 percent; away teams led 2,780 times, won 70 percent and lost 10.2 percent, almost twice as often as home leaders, at 5.4 percent.
The gap is widest for the most common lead, a single goal. Home sides a goal up at the break won 74 percent and lost 7.2 percent; away sides won 63 percent and lost 12.6 percent, about one game in eight. It is the edge our count of home advantage found last season, when home teams won 42.6 percent of Premier League games and away teams 30.0 percent.
Premier League comebacks from losing at half-time
The side behind at half-time came back to win 510 times in 31 seasons, 7.4 percent of the games with a leader: 471 times from one goal down, 36 from two and three from three. Home teams made 284 of those comebacks and away teams 226.
They have become more common. In the 2020s so far, 9.4 percent of half-time leads have been lost, against 5.7 percent in the late 1990s, 7.2 in the 2000s and 7.0 in the 2010s. The last three seasons are the three highest since 1995-96: 10.6 percent in 2023-24, 11.8 in 2024-25, with a peak of 29 lost leads, and 9.7 in 2025-26. No earlier season topped 9.5.
Again it is the one-goal lead that changed. Over the last three seasons, teams a goal up at half-time won 62 percent and lost 14.2 percent; in the 28 seasons before, they won 70 percent and lost 8.9 percent. Two-goal leads held about as well as ever, 91 percent won against 92 percent.
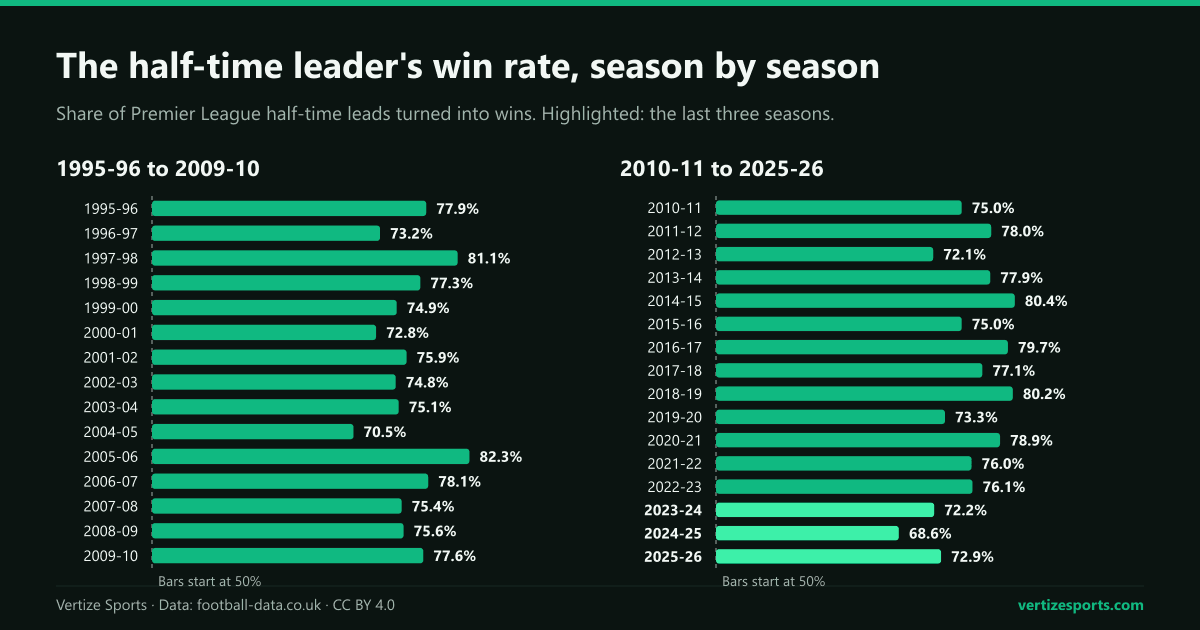
The scores alone cannot say why. Second-half goals peaked in 2023-24, at 1.92 a game against a 31-season average of 1.50, but 2024-25, with more comebacks, was back at 1.57, and no club lost more than four leads that season.
The biggest Premier League comebacks: three goals down at half-time
Since 1995-96, only three teams have won after trailing by three goals at half-time, all of them from 3-0:
- Manchester United, 3-0 down at Tottenham Hotspur on 29 September 2001, won 5-3.
- Wolverhampton Wanderers, 3-0 down at home to Leicester City on 25 October 2003, won 4-3.
- AFC Bournemouth, 3-0 down at home to Luton Town on 13 March 2024, won 4-3.
The league's own count agrees and covers the three 22-club seasons too: Bournemouth's win was only the third from 3-0 down at half-time in Premier League history, and the fifth from 3-0 down at any point. No team has done it since.
No lead of four goals or more has been lost in that time: 74 of 75 were won, and the other ended 4-4 after Newcastle United trailed Arsenal 4-0 at the break on 5 February 2011. Three times a 3-0 half-time lead ended 3-3: West Ham United came back at West Bromwich Albion in February 2011 and at Tottenham Hotspur in October 2020, and Chelsea at West Brom in September 2020.
In the other four big leagues, a half-time lead of three goals or more has been lost four times since 1995-96, most recently when Bayern Munich won 4-3 at Mainz in April 2026 from 3-0 down. The widest gap overturned was in France: Marseille beat Montpellier 5-4 in August 1998 from 4-0 down.
When a Premier League game is a draw at half-time
Of the 4,849 games tied at the break, the home side won 37.0 percent, 37.4 percent stayed level and the away side won 25.6 percent. The most common half-time score of all is 0-0, in 30 percent of games, and a quarter of those, 900 of 3,535, also finished goalless.
| At half-time | Games | Home win | Draw | Away win |
|---|---|---|---|---|
| Home team ahead | 4,151 | 3,324 (80.1%) | 601 (14.5%) | 226 (5.4%) |
| Level | 4,849 | 1,792 (37.0%) | 1,814 (37.4%) | 1,243 (25.6%) |
| Away team ahead | 2,780 | 284 (10.2%) | 555 (20.0%) | 1,941 (69.8%) |
Most draws start as draws: of the 2,970 drawn games, 1,814 were level at half-time. The other 1,156 were half-time leads that slipped.
Which clubs protect a half-time lead best
Over the last five seasons, 2021-22 to 2025-26, 20 clubs led at half-time at least 25 times, our minimum. Liverpool won 73 of their 81 half-time leads, 90 percent, and lost one, 3-2 at Brighton & Hove Albion in May 2025. Manchester United also lost one, the 3-1 derby defeat by Manchester City in March 2024.
| Club | Half-time leads | Won | Lost | Win rate | Points dropped |
|---|---|---|---|---|---|
| Liverpool | 81 | 73 | 1 | 90.1% | 17 |
| Arsenal | 93 | 78 | 3 | 83.9% | 33 |
| Manchester City | 107 | 88 | 4 | 82.2% | 42 |
| Manchester United | 62 | 50 | 1 | 80.6% | 25 |
| Aston Villa | 62 | 50 | 4 | 80.6% | 28 |
| Tottenham Hotspur | 63 | 49 | 8 | 77.8% | 36 |
| Newcastle United | 69 | 53 | 9 | 76.8% | 41 |
| Leicester City | 25 | 19 | 1 | 76.0% | 13 |
| Brighton & Hove Albion | 60 | 45 | 3 | 75.0% | 33 |
| Brentford | 58 | 42 | 8 | 72.4% | 40 |
| Fulham | 38 | 27 | 3 | 71.1% | 25 |
| Chelsea | 65 | 46 | 5 | 70.8% | 43 |
| Nottingham Forest | 40 | 28 | 5 | 70.0% | 29 |
| Wolverhampton Wanderers | 43 | 29 | 7 | 67.4% | 35 |
| AFC Bournemouth | 46 | 30 | 5 | 65.2% | 37 |
| Crystal Palace | 50 | 32 | 7 | 64.0% | 43 |
| West Ham United | 50 | 32 | 9 | 64.0% | 45 |
| Everton | 47 | 30 | 7 | 63.8% | 41 |
| Leeds United | 27 | 16 | 5 | 59.3% | 27 |
| Southampton | 27 | 10 | 8 | 37.0% | 42 |
At the other end, Southampton won 10 of their 27 and lost eight, and West Ham United dropped the most points from half-time leads, 45. The order mostly follows the table: better teams add to leads or see them out. Manchester City led at the break most often, 107 times, and were best at the reverse too: behind only 26 times, they won nine.
Half-time leads in LaLiga, Serie A, Bundesliga and Ligue 1
Football-data.co.uk has half-time scores for the other four big European leagues over the same seasons, missing six games plus 130 Ligue 1 games from 1995-96 to 1997-98, which are left out. Premier League leaders held on most often, though the spread is under three points:
| League | Games with a half-time leader | Leader won | Draw | Leader lost | Leader lost, last 3 seasons |
|---|---|---|---|---|---|
| Premier League | 6,931 | 76.0% | 16.7% | 7.4% | 10.7% |
| LaLiga | 6,851 | 75.3% | 16.8% | 7.9% | 9.7% |
| Bundesliga | 5,719 | 75.1% | 17.0% | 7.9% | 9.0% |
| Ligue 1 | 6,122 | 74.6% | 18.0% | 7.4% | 7.2% |
| Serie A | 6,369 | 73.3% | 18.7% | 7.9% | 9.0% |
Serie A leaders drew most often, 18.7 percent of the time, in the league that scores the fewest goals, 2.43 a game last season against the Bundesliga's 3.24. The Bundesliga had a half-time leader in 60 percent of its games, the most of the five.
The recent rise in comebacks is sharpest in England. Over the last three seasons, Premier League half-time leaders lost 10.7 percent of the time, more than in any of the other four leagues; in the 28 seasons before, they lost 7.0 percent, the lowest of the five.
Half-time leads in the 2026-27 Premier League so far
Through five matchweeks, the last played on 20 September, 27 of the 50 games have had a half-time leader. Eighteen of those leaders won, seven drew and two lost: Manchester City beat AFC Bournemouth 2-1 on 23 August after trailing 1-0 at the break, and Crystal Palace won 3-2 at Fulham on 5 September after trailing 2-1.
One-goal leads have been shakier still: nine of 18 were won, seven drawn and two lost. Liverpool have twice come from behind at half-time to draw 2-2, at Newcastle United and at home to Nottingham Forest. All nine leads of two goals or more were won.
The league resumes with matchweek 6 on 10 October. The Premier League table and fixtures show where things stand, and the Premier League simulator lets you put a score on any game left.
Premier League half-time leads: frequently asked questions
How often does the team leading at half-time win in the Premier League? About three times in four. Since 1995-96, half-time leaders have won 76 percent of games, drawn 17 percent and lost 7 percent.
Is a one-goal lead at half-time safe? Not entirely. One-goal leads were won 69 percent of the time, 63 percent away from home, and only 62 percent over the last three seasons.
Has a Premier League team come back from 3-0 down at half-time to win? Three times: Manchester United at Tottenham Hotspur in 2001, Wolverhampton Wanderers against Leicester City in 2003 and AFC Bournemouth against Luton Town in 2024.
What happens when a Premier League game is a draw at half-time? The home side wins 37 percent of the time and the away side 26 percent; the other 37 percent stay level.
Which club is best at holding a half-time lead? Over the last five seasons, Liverpool: they won 73 of their 81 half-time leads, 90 percent, and lost one.
How this was built: every Premier League game from 1995-96 to 2025-26, 11,780 in all, with its half-time and full-time score from football-data.co.uk. Scores from 2008-09 on, 6,840 games plus the 50 of 2026-27, match the league's own data behind premierleague.com game for game. The other four leagues come from the same source and seasons; games without a half-time score are left out, and Ligue 1's 2019-20 counts the 279 games played. Decades run by season: the 1990s are 1995-96 to 1999-2000, the 2020s 2020-21 to 2025-26. The 2026-27 games run through matchweek 5, on 20 September, and their table matches the official standings of 30 September.