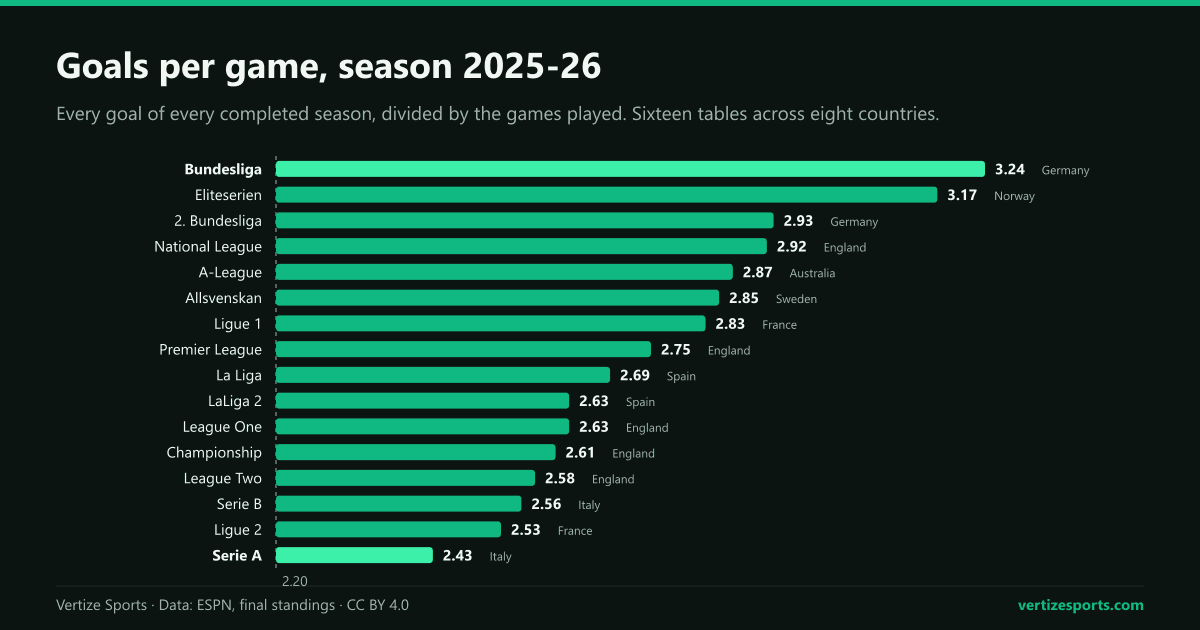
We took the final table of sixteen leagues across eight countries, added up the goals and divided by the games: 16,520 goals in 6,049 matches of the 2025-26 season. No sampling, no adjusting, just the tables as they finished.
Goals
| League | Country | Goals a game | Draws | Spread |
|---|---|---|---|---|
| Bundesliga | Germany | 3.24 | 24.5% | 17.1 |
| Eliteserien | Norway | 3.17 | 18.8% | 15.7 |
| 2. Bundesliga | Germany | 2.93 | 24.2% | 10.6 |
| National League | England | 2.92 | 23.2% | 20.9 |
| A-League | Australia | 2.87 | 26.3% | 7.3 |
| Allsvenskan | Sweden | 2.85 | 22.1% | 14.3 |
| Ligue 1 | France | 2.83 | 24.3% | 15.5 |
| Premier League | England | 2.75 | 27.4% | 15.4 |
| La Liga | Spain | 2.69 | 24.5% | 15.8 |
| LaLiga 2 | Spain | 2.63 | 24.9% | 14.3 |
| League One | England | 2.63 | 25.2% | 15.4 |
| Championship | England | 2.61 | 26.4% | 17.9 |
| League Two | England | 2.58 | 24.8% | 16.0 |
| Serie B | Italy | 2.56 | 31.1% | 14.7 |
| Ligue 2 | France | 2.53 | 30.4% | 12.3 |
| Serie A | Italy | 2.43 | 26.1% | 17.8 |
The Bundesliga is top on 3.24 goals a game, with Eliteserien close behind on 3.17; Serie A sits at the bottom on 2.43. The median league in this group produces 2.72, which means a season of Bundesliga football hands you roughly one extra goal every two matches compared with a season of Serie A.
The second division numbers are the ones that surprise people. English football's fifth tier, the National League, produced 2.92 goals a game, more than the Premier League at 2.75. Lower-division football is not more cautious; it is less controlled, which is not the same thing.
The pattern is national, not divisional
Line the countries up in pairs and the leagues sort themselves by border rather than by level. Germany's two divisions are 3.24 and 2.93, the highest pair on the list. France drops from 2.83 in Ligue 1 to 2.53 in Ligue 2, the steepest fall between a first and a second tier. And Italy is the only country here where the second division outscores the first: Serie B at 2.56 against Serie A at 2.43.
Whatever produces a goal rate, it is not simply the quality of the football. The best league in this list by any measure of talent sits eighth.
Draws
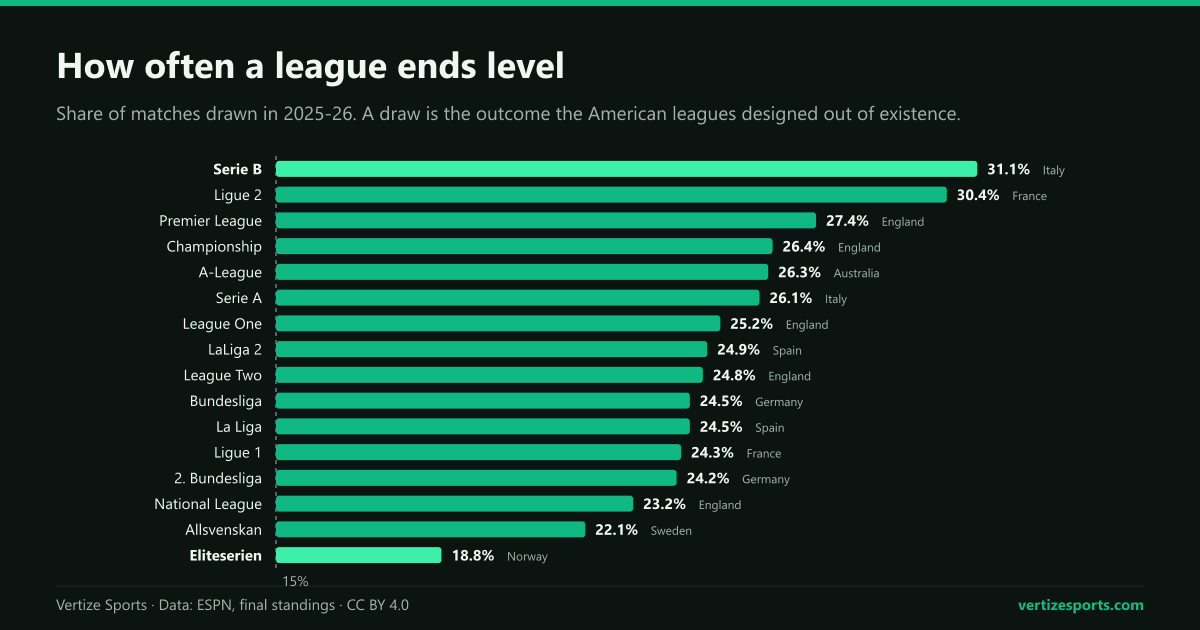
A draw is the outcome American sport designed out of existence, and it is not a rounding error: 31.1 percent of Serie B matches ended level, against 18.8 percent in Eliteserien. Over a 38-game season that difference is roughly five extra results where nobody wins.
It also changes what a point is worth. In a league that draws a third of its games, a run of draws keeps you afloat; in one that draws a fifth, the same run leaves you behind the teams that are winning and losing around you.
How close the table finishes
The last column of the table is the one nobody publishes: the spread of the points column, which is the simplest measure of how unequal a league is. The tightest of the sixteen was the A-League at 7.3, the widest the National League at 20.9. A high number means the table stretches out, with a runaway top and a detached bottom; a low one means everyone finished within a few wins of everyone else.
This is the number that decides how a season feels. Two leagues can score identically and still produce completely different Aprils: one where four teams are alive for the title and one where the only question left is who goes down.
What it changes in a simulation
These numbers are not trivia for us. The soccer simulator draws goals from a Poisson distribution whose average is exactly this: 1.50 for the home side and 1.25 for the away side in the Premier League. Feed it a league that scores 3.24 a game and the same model needs different averages, which is why a table's goal rate is the first thing worth knowing about it.
- Every league here has its table, its fixtures and a simulator you can play out to the end of the season.
- The lower divisions are where the numbers are strangest, and they are covered in the same detail as the first ones: Championship, Serie B, LaLiga 2, Ligue 2.
- For what it costs to get out of one of them, we counted the points that promotion takes.
Counted from the final 2025-26 table of each league, which is why Denmark is missing: its season splits into two groups and no single table covers it. Goals a game counts both teams, so 2.75 means a typical match finished 2-1 or 3-0. The spread is a population standard deviation of the points column, so leagues with more teams are not penalised for having more of them.