We counted every NHL regular-season game since 2005-06, the first season in which a shootout replaced the tie, 25,302 games through 2025-26, from the NHL's game results. Each one ended in regulation, in overtime or in a shootout. Today a tied game goes to five minutes of 3-on-3 sudden-death overtime, then to a shootout of three rounds and sudden-death rounds after that; the playoffs have no shootout. The winner gets two points and the loser one, a rule whose effect on the standings is the subject of our analysis of the NHL loser point.
How often NHL games go to overtime, season by season
Across the 21 seasons, 5,824 of 25,302 games went past regulation, 23.0 percent. The share has stayed in a narrow band: from 20.7 percent in 2023-24 and 2024-25 to 25.0 percent in 2013-14. Last season, 2025-26, 326 games went to extra time, 24.8 percent, the highest share since 2014-15.
| Season | Games | Past regulation | Ended in overtime | Shootouts | Settled in overtime |
|---|---|---|---|---|---|
| 2005-06 | 1,230 | 281 (22.8%) | 136 | 145 | 48.4% |
| 2006-07 | 1,230 | 281 (22.8%) | 117 | 164 | 41.6% |
| 2007-08 | 1,230 | 272 (22.1%) | 116 | 156 | 42.6% |
| 2008-09 | 1,230 | 282 (22.9%) | 123 | 159 | 43.6% |
| 2009-10 | 1,230 | 301 (24.5%) | 117 | 184 | 38.9% |
| 2010-11 | 1,230 | 297 (24.1%) | 148 | 149 | 49.8% |
| 2011-12 | 1,230 | 300 (24.4%) | 119 | 181 | 39.7% |
| 2012-13 | 720 | 162 (22.5%) | 65 | 97 | 40.1% |
| 2013-14 | 1,230 | 307 (25.0%) | 129 | 178 | 42.0% |
| 2014-15 | 1,230 | 306 (24.9%) | 136 | 170 | 44.4% |
| 2015-16 | 1,230 | 275 (22.4%) | 168 | 107 | 61.1% |
| 2016-17 | 1,230 | 289 (23.5%) | 190 | 99 | 65.7% |
| 2017-18 | 1,271 | 296 (23.3%) | 193 | 103 | 65.2% |
| 2018-19 | 1,271 | 271 (21.3%) | 184 | 87 | 67.9% |
| 2019-20 | 1,082 | 250 (23.1%) | 164 | 86 | 65.6% |
| 2020-21 | 868 | 195 (22.5%) | 130 | 65 | 66.7% |
| 2021-22 | 1,312 | 288 (22.0%) | 186 | 102 | 64.6% |
| 2022-23 | 1,312 | 302 (23.0%) | 207 | 95 | 68.5% |
| 2023-24 | 1,312 | 272 (20.7%) | 190 | 82 | 69.9% |
| 2024-25 | 1,312 | 271 (20.7%) | 194 | 77 | 71.6% |
| 2025-26 | 1,312 | 326 (24.8%) | 207 | 119 | 63.5% |
That is far more extra time than other sports on this site see. In the NFL, 6.0 percent of regular-season games went to overtime from 2002 to 2025, and in rugby league 182 NRL games have gone to golden point since 2003.
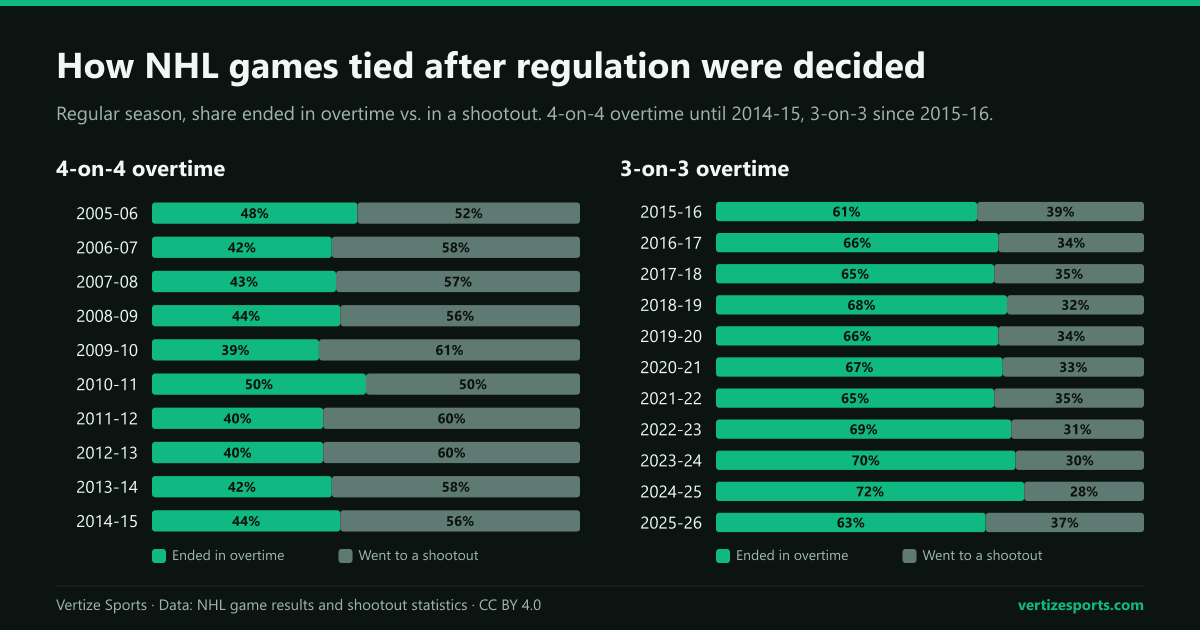
3-on-3 overtime vs. 4-on-4: how often overtime settles the game
Under 4-on-4, overtime settled 1,206 of 2,789 tied games, 43.2 percent; under 3-on-3 it has settled 2,013 of 3,035, 66.3 percent. The best 4-on-4 season, 49.8 percent in 2010-11, is below the worst 3-on-3 season, 61.1 percent in 2015-16, the first.
Our counts match the figures the NHL gave when its general managers reviewed the format in March 2024: 44 percent in 2014-15, 65 in 2021-22 and 69 in 2022-23. They leaned toward leaving it alone, in part because it was reducing shootouts as intended. The 2023-24 season finished at 69.9 percent and the high came in 2024-25, 71.6 percent. In 2025-26 the share fell to 63.5 percent, the lowest since 2015-16.
What 3-on-3 did not change is how many games are tied after 60 minutes: 23.7 percent under 4-on-4 and 22.5 percent since. The format decides how those games end, not how many there are.
NHL shootouts per season and the decline
There were 145 shootouts in 2005-06 and a record 184 in 2009-10, 15.0 per 100 games. The rate fell to 5.9 per 100 games in 2024-25, 77 shootouts and the lowest rate of any season, before rising to 119 in 2025-26, 9.1 per 100, the most since 3-on-3 began.
- 4-on-4 era, 2005-06 to 2014-15: 1,583 shootouts in 11,790 games, 13.4 per 100.
- 3-on-3 era, 2015-16 to 2025-26: 1,022 shootouts in 13,512 games, 7.6 per 100, 44 percent fewer.
- In all, 2,605 regular-season games have been decided by a shootout since 2005-06.
- The shootout itself has not changed much. Shooters scored on 32.5 percent of attempts under 4-on-4 and 31.5 percent since, and a shootout takes about 7.1 attempts on average.
Home ice in NHL overtime and shootouts
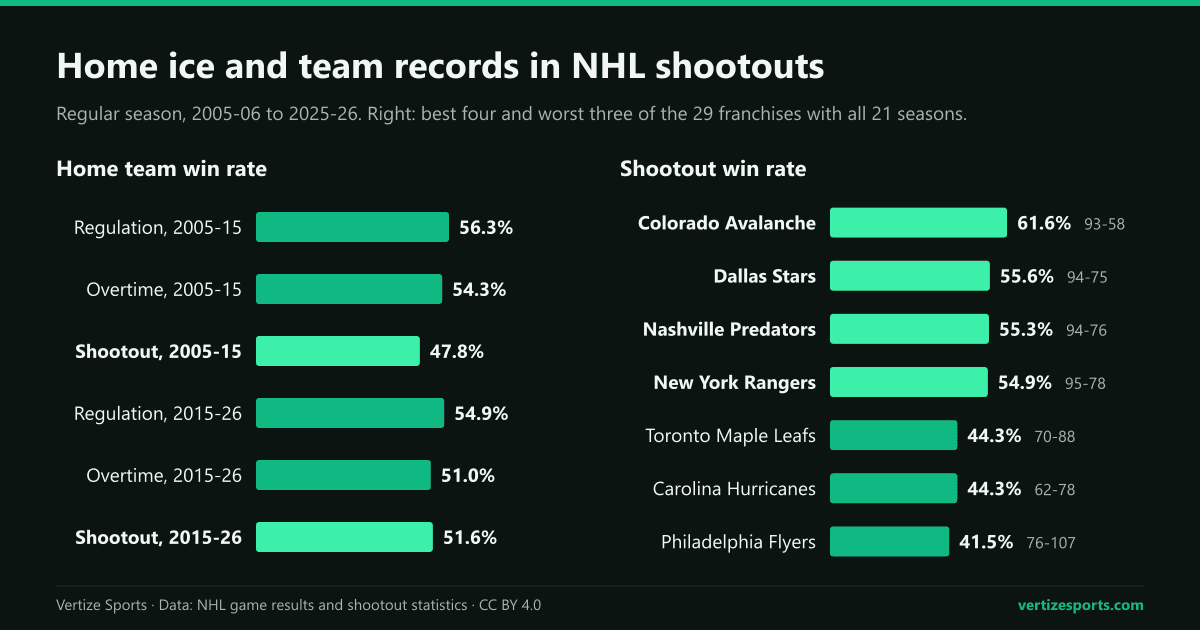
Home teams won 55.5 percent of games decided in regulation, 52.2 percent of those decided in overtime and 49.3 percent of shootouts, 1,284 of 2,605. The edge shrinks as the game goes on, and in the shootout it is gone.
Under 4-on-4, home teams won 47.8 percent of shootouts, 757 of 1,583, a shortfall within what chance alone would produce. Since 2015-16 they have won 51.6 percent. In 3-on-3 overtime the home side has won 51.0 percent, against 54.3 percent in 4-on-4 overtime.
Best NHL teams and players in shootouts
Of the 29 franchises that played all 21 seasons, the Colorado Avalanche have the best shootout record, 93-58, 61.6 percent, followed by the Dallas Stars, Nashville Predators and New York Rangers. The Philadelphia Flyers have the worst, 76-107, 41.5 percent. The Winnipeg Jets' record includes their seasons as the Atlanta Thrashers.
Most of that spread is luck. If every shootout were a coin flip, team records over this many shootouts would vary by about 3.8 percentage points; they vary by 4.2. A team's record in seasons starting in odd years barely predicts its record in even years, a correlation of 0.15, and for overtime games there is no link at all.
Some individual records are harder to put down to chance. Leaguewide, shooters have scored on 32 percent of attempts since 2005-06, according to the NHL's shootout statistics, through 2025-26:
- Patrick Kane has the most shootout goals, 55 on 135 attempts, and shares the lead in game-deciding shootout goals, 23, with Frans Nielsen.
- Jonathan Toews is next with 52 goals on 112 attempts, then T.J. Oshie (49 of 104) and Nielsen (49 of 106).
- Among shooters with 50 or more attempts, Artemi Panarin has the best rate: 29 goals on 52 attempts, 55.8 percent. Erik Christensen also scored 29 times, on 55 attempts.
- Marc-Andre Fleury has the most shootout wins by a goalie, 66, ahead of Henrik Lundqvist with 61 and Ryan Miller with 60. Lundqvist faced the most attempts, 406.
- Among goalies who faced 200 or more attempts, Semyon Varlamov has the best save rate, 72.9 percent (156 of 214), against a league average of about 68 percent.
The figures agree with the Associated Press review of 20 years of the shootout, published in October 2025, once the 2025-26 season is added.
NHL overtime and shootouts in 2026-27 so far
The 2026-27 season began on Tuesday, September 29, with 84 games per team on the NHL schedule. Through the games of Monday, October 12, 89 of the 1,344 scheduled games had been played and 18 had gone past regulation, 20.2 percent: 13 were decided in overtime and 5 in a shootout. The official standings list the same 18 overtime and shootout losses.
The first shootout of the season came on Thursday, October 8, when the Vegas Golden Knights beat the Toronto Maple Leafs. On Saturday, October 10, the Montreal Canadiens beat the Detroit Red Wings 1-0 in a game that was scoreless after overtime. Home teams have won all five shootouts so far and 8 of the 13 overtime games, a sample too small to mean anything yet. Our NHL standings count each one as it happens, and the NHL simulator lets you decide the rest of the season's games, overtime losses included.
NHL overtime and shootouts: frequently asked questions
How does NHL overtime work? In the regular season, a game tied after 60 minutes goes to five minutes of 3-on-3 sudden-death overtime, then to a shootout of three rounds plus sudden-death rounds. In the playoffs there is no shootout: teams play 20-minute sudden-death overtime periods until someone scores.
How often do NHL games go to a shootout? About 7.6 times per 100 games since 3-on-3 overtime began in 2015-16, against 13.4 per 100 under 4-on-4. There were 119 shootouts in 2025-26, the most in the 3-on-3 era.
Does the home team have an advantage in NHL shootouts? No. Home teams have won 49.3 percent of shootouts since 2005-06, against 55.5 percent of games decided in regulation.
Who has the most shootout goals in NHL history? Patrick Kane, with 55 on 135 attempts through 2025-26, ahead of Jonathan Toews with 52.
How this was built: every regular-season game from 2005-06 to 2025-26 (25,302 games) from the NHL's stats API, classified by the period in which it ended: regulation, overtime or shootout. Shootout games carry one extra goal for the winner in the final score, as the NHL records them. Season totals match the shootout wins and overtime losses in the NHL's final standings, except for one overtime loss in 2023-24 that the standings credit and the game list does not. Team records are by franchise. Player and goalie figures, and leaguewide attempts, are the NHL's regular-season shootout statistics for the same seasons. The odd-even comparison correlates each franchise's win rate in seasons starting in odd years with its rate in even years. The 2026-27 results include only games finished by October 12, 2026, retrieved from the NHL that day.