We counted it from the NHL's own team records, the Score/Trail First and Leading/Trailing reports behind NHL Stats, which cover every regular season since 1917-18, checked against the league's game-by-game results. The first goal is the first one in regulation or overtime, so the 56 games since 2005-06 that were still 0-0 when a shootout began are left out, as are scoreless ties before that.
NHL teams scoring first: win percentage by season
Since every game started producing a winner in 2005-06, the first scorer's win rate has moved in a narrow band, from 65.7 percent in 2016-17 and 2024-25 to 70.3 percent in the 48-game 2012-13 season. Over those 21 seasons first scorers won 17,110 of 25,246 games and took 73.5 percent of the points available to them, counting the point for an overtime or shootout loss.
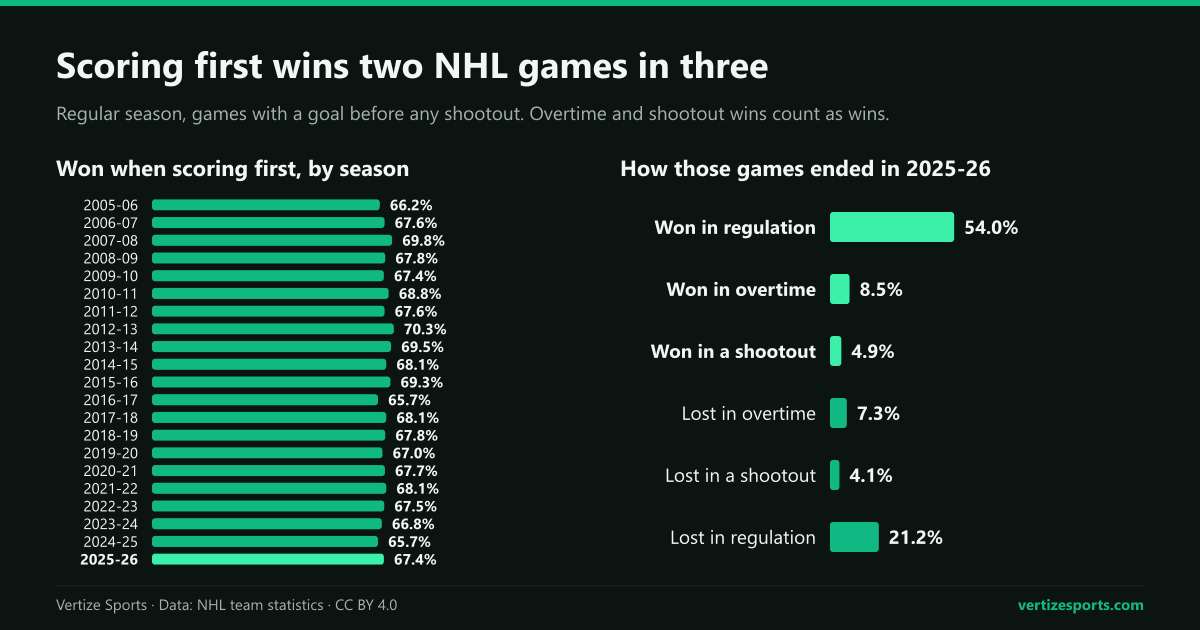
Regulation, overtime and shootout: how the first scorer's games end
Almost all of the first goal's value is collected in regulation. In 2025-26 the team that scored first won 708 games in regulation and lost 278. Another 325 of its games went past regulation, and it won 175 of those, 53.8 percent:
| How the game ended | 2025-26 | 2005-06 to 2025-26 |
|---|---|---|
| Won in regulation | 54.0% | 56.3% |
| Won in overtime | 8.5% | 6.3% |
| Won in a shootout | 4.9% | 5.2% |
| Lost in overtime | 7.3% | 6.5% |
| Lost in a shootout | 4.1% | 4.9% |
| Lost in regulation | 21.2% | 20.8% |
| Points percentage | 73.1% | 73.5% |
| Games | 1,311 | 25,246 |
Over 21 seasons, overtime has been a coin flip for the first scorer: 1,590 wins in the 3,219 games decided in overtime, 49.4 percent, and 1,304 in 2,549 shootouts, 51.2 percent, against 73.0 percent of the games settled in regulation. Losing after regulation still earns the point for an overtime loss, which is why the first scorer's points percentage runs about six percentage points ahead of its win rate.
NHL team leading after two periods: win percentage
The later the lead, the safer it is. Teams leading after one period won 72.6 percent of the time in 2025-26, and teams leading after two won 86.0 percent, 855 of 994 games; since 2005-06 the figures are 74.4 and 85.0 percent. The two-period figure has ranged from 83.3 percent in 2006-07 to 86.3 percent in 2020-21, and 2025-26 was the third-highest of the 21 seasons.
NHL third-period comebacks and comeback wins
Teams trailing after two periods won 139 of the 994 games in 2025-26, 14.0 percent: 51 in regulation and 88 after tying the game and winning in overtime or a shootout. Another 103 times they tied the game and lost after regulation, so the team behind after two periods took at least a point in 242 games, 24.3 percent.
A full comeback inside 60 minutes is no more common than in the four decades without overtime. Teams leading after two periods have lost in regulation 5.9 percent of the time since 2005-06, and 5.1 percent in 2025-26. From 1943-44 to 1982-83, when regular-season games had no overtime, the rate was 6.0 percent, and another 12.9 percent ended in ties. What changed is the tied game: it now always produces a winner, and last season the team that came back won 88 of 191.
Comeback wins in the broader sense, by a team that gave up the first goal, came in 428 of 2025-26's 1,311 games, 32.6 percent. In January an NHL.com Coaches Room column counted 71 multigoal comeback wins in the season's first 666 games. The Dallas Stars had the most wins after trailing after two periods, eight.
Holding leads in 2025-26: the best and worst NHL teams
The Colorado Avalanche, who finished with a league-high 121 points, won all 41 games they led after two periods and were 42-2-6 when they scored first, 84.0 percent, the best rate in the league. The New Jersey Devils were also perfect after two periods, at 24-0-0, and the Tampa Bay Lightning lost once in 34. The Dallas Stars, Philadelphia Flyers and Vegas Golden Knights never lost in regulation with a lead after two, though each dropped three such games after regulation.
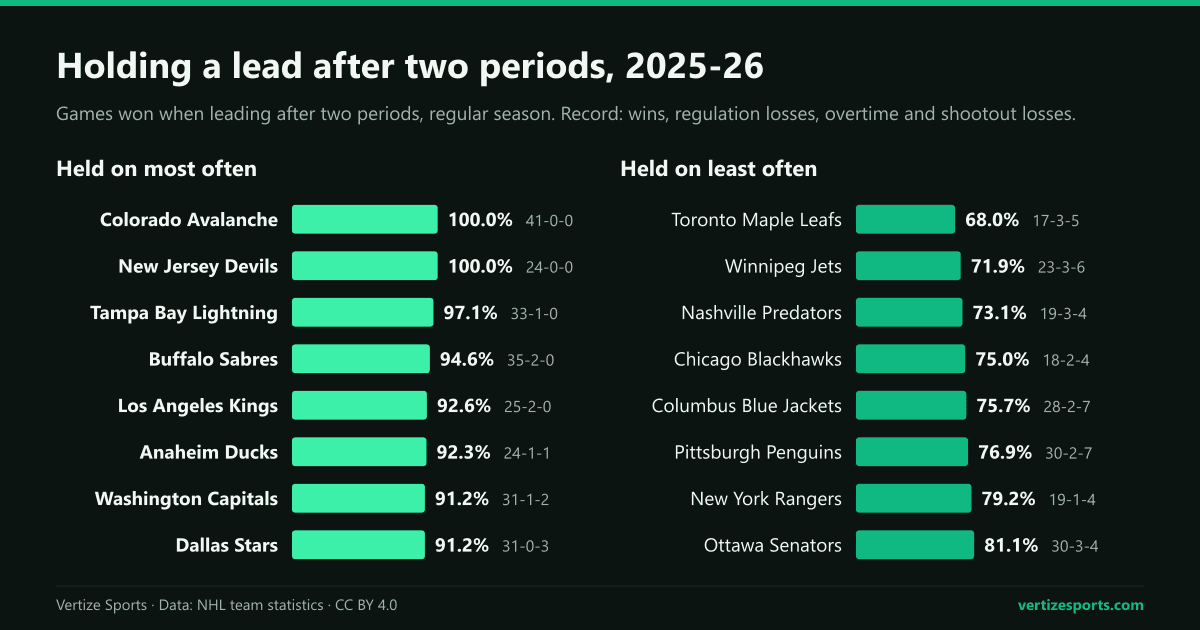
The Toronto Maple Leafs held a lead after two periods least often, 17 times in 25, 68.0 percent, and won only 18 of the 38 games in which they scored first. The Vancouver Canucks won 13 of 32 after scoring first, 40.6 percent, the lowest rate, and the Chicago Blackhawks were the third team below half. The Columbus Blue Jackets, Pittsburgh Penguins and Winnipeg Jets let a lead after two periods slip nine times each, the most, though most of those games still earned them a point.
| Team | Scored first | Led after two periods |
|---|---|---|
| Anaheim Ducks | 22-9-2 | 24-1-1 |
| Boston Bruins | 27-8-6 | 33-2-4 |
| Buffalo Sabres | 36-6-2 | 35-2-0 |
| Calgary Flames | 21-14-4 | 22-2-3 |
| Carolina Hurricanes | 36-10-3 | 37-2-2 |
| Chicago Blackhawks | 22-15-8 | 18-2-4 |
| Colorado Avalanche | 42-2-6 | 41-0-0 |
| Columbus Blue Jackets | 32-11-7 | 28-2-7 |
| Dallas Stars | 34-6-2 | 31-0-3 |
| Detroit Red Wings | 26-7-3 | 28-2-3 |
| Edmonton Oilers | 30-5-5 | 31-1-5 |
| Florida Panthers | 29-9-3 | 25-1-2 |
| Los Angeles Kings | 28-6-7 | 25-2-0 |
| Minnesota Wild | 33-6-6 | 34-1-4 |
| Montreal Canadiens | 32-10-4 | 29-4-2 |
| Nashville Predators | 21-6-4 | 19-3-4 |
| New Jersey Devils | 27-6-1 | 24-0-0 |
| New York Islanders | 28-12-3 | 22-2-1 |
| New York Rangers | 26-7-3 | 19-1-4 |
| Ottawa Senators | 28-6-6 | 30-3-4 |
| Philadelphia Flyers | 23-5-4 | 26-0-3 |
| Pittsburgh Penguins | 31-7-9 | 30-2-7 |
| San Jose Sharks | 23-11-4 | 28-1-2 |
| Seattle Kraken | 24-13-4 | 21-2-1 |
| St. Louis Blues | 27-12-8 | 26-2-2 |
| Tampa Bay Lightning | 31-5-2 | 33-1-0 |
| Toronto Maple Leafs | 18-11-9 | 17-3-5 |
| Utah Mammoth | 30-12-2 | 29-2-2 |
| Vancouver Canucks | 13-15-4 | 13-1-2 |
| Vegas Golden Knights | 23-4-7 | 23-0-3 |
| Washington Capitals | 34-10-6 | 31-1-2 |
| Winnipeg Jets | 26-12-6 | 23-3-6 |
Home and road: who scores first and who holds on
- Home teams scored first in 52.7 percent of games since 2005-06, and 51.1 percent in 2025-26.
- Home teams that scored first won 71.1 percent of the time and road teams 64.0 percent; in 2025-26, 69.1 and 65.5 percent.
- Leading after two periods, home teams won 86.9 percent of the time and road teams 82.7 percent.
Those gaps sit on top of a small home edge: NHL home teams won 52.2 percent of all games in 2025-26, the smallest edge of the six leagues whose home advantage we measured.
Scoring first in NHL history, decade by decade
For most of the league's history a game could end in a tie, so first scorers won less often: between 58 and 62 percent in every decade from the 1940s to the 1990s, with ties taking 13 to 18 percent of their games. Teams leading after two periods won 80 to 82 percent of the time in those decades, and ties took most of the rest. Across all 64,998 games with a first goal since 1917-18, the first scorer won 63.7 percent.
The first goal counted most in the 1920s, when first scorers won 70.4 percent and lost only 20.6 percent, in the decade with the fewest goals, 4.69 a game by our count of NHL scoring. It counted least in the 1980s, the highest-scoring full decade at 7.67 goals a game, when first scorers won 58.2 percent.
Scoring first in 2026-27: too early to tell
The 2026-27 season opened on September 29 with five games, and the team that scored first won four. The Toronto Maple Leafs scored 48 seconds into their opener and lost 3-2 to the Montreal Canadiens, and the Vancouver Canucks let a 5-2 third-period lead at the Edmonton Oilers slip, conceding the tying goal with 43 seconds left, before winning 6-5 in overtime. Five games say nothing about a season of 1,344 games.
The NHL schedule lists every game night by night, with scores once a night is finished. The NHL simulator plays out the rest of the season from the real standings, with finished games locked and overtime and the loser point included.
NHL scoring first and leads by season: the full table
| Season | Scored first: won | Scored first: points | Led after one: won | Led after two: won |
|---|---|---|---|---|
| 2025-26 | 67.4% | 73.1% | 72.6% | 86.0% |
| 2024-25 | 65.7% | 71.3% | 71.7% | 85.2% |
| 2023-24 | 66.8% | 72.7% | 75.1% | 84.3% |
| 2022-23 | 67.5% | 72.6% | 75.1% | 85.4% |
| 2021-22 | 68.1% | 73.1% | 77.2% | 85.7% |
| 2020-21 | 67.7% | 73.5% | 74.3% | 86.3% |
| 2019-20 | 67.0% | 72.8% | 74.3% | 84.4% |
| 2018-19 | 67.8% | 73.3% | 73.7% | 85.6% |
| 2017-18 | 68.1% | 74.0% | 76.5% | 85.5% |
| 2016-17 | 65.7% | 71.6% | 72.2% | 84.6% |
| 2015-16 | 69.3% | 74.5% | 76.1% | 85.3% |
| 2014-15 | 68.1% | 74.1% | 74.7% | 83.6% |
| 2013-14 | 69.5% | 75.7% | 74.7% | 83.8% |
| 2012-13 | 70.3% | 75.4% | 76.6% | 84.4% |
| 2011-12 | 67.6% | 73.9% | 74.9% | 85.3% |
| 2010-11 | 68.8% | 74.9% | 74.9% | 86.2% |
| 2009-10 | 67.4% | 73.5% | 73.4% | 85.0% |
| 2008-09 | 67.8% | 73.1% | 73.2% | 85.2% |
| 2007-08 | 69.8% | 75.7% | 75.0% | 85.6% |
| 2006-07 | 67.6% | 73.3% | 72.9% | 83.3% |
| 2005-06 | 66.2% | 71.6% | 73.3% | 84.3% |
Scoring first in the NHL: frequently asked questions
How often does the team that scores first win in the NHL? 67.4 percent of the time in 2025-26 and 67.8 percent since 2005-06, counting every game with a goal before any shootout. First scorers lose in regulation about one game in five, 20.8 percent since 2005-06.
What is the win percentage of an NHL team leading after two periods? 86.0 percent in 2025-26 and 85.0 percent since 2005-06. Those teams lose in regulation about 6 percent of the time, and the rest of their losses come in overtime or a shootout.
How often do NHL teams come back in the third period? A team trailing after two periods won 14.0 percent of the time in 2025-26, 139 games, 51 of them in regulation. Since 2005-06 it is 15.0 percent.
Does scoring first matter in overtime? Hardly. Since 2005-06 the team that scored first has won 49.4 percent of games decided in overtime and 51.2 percent of shootouts.
How this was built: the records are the NHL's regular-season team reports for scoring or trailing first and for leading or trailing after one and two periods, from the league's stats API (the data behind NHL Stats), summed across teams for every season from 1917-18 to 2025-26 and checked against the league's game results. We removed games with no goal before a shootout, which the reports credit to one team or to both, and the two 1918 games the Montreal Wanderers did not play. Overtime and shootout results since 2005-06 are matched game by game. The 2026-27 figures are the five games of September 29, 2026.